Investment Analysis: Better Home & Finance Holding Co (NASDAQ: BETR)
Date: May 5, 2026 Analyst: Cipher Research Scope: Public-market investment analysis using public information only: SEC filings, company investor relations, public market data, company website materials, mortgage-market forecasts, proxy disclosures, and public news/litigation coverage. Verdict: PASS / WATCHLIST Confidence: Medium Score: 43/100
Sources Reviewed
| Source | Use in report |
|---|---|
| Better FY2025 Form 10-K, filed Mar. 13, 2026 | Audited financials, risks, public-company disclosures |
| Better Q4 2025 results | Q4 revenue, funded loan volume, net loss, adjusted EBITDA, Tinman volume |
| Better Q1 2026 preliminary update | Q1 2026 preliminary volume, capital raise, cash target, cost reductions |
| Better investor overview | Business description, Tinman, Betsy, cumulative funded volume claim |
| Better company overview | Mission, positioning, customer proposition |
| Better crypto-backed mortgages page | Token-backed mortgage waitlist, Coinbase relationship, Bitcoin/USDC collateral mechanics |
| MBA 2026 mortgage origination forecast | Market size and 2026 industry-growth backdrop |
| Better 2026 Proxy Statement | Board, ownership, founder control, major stockholders |
| Yahoo Finance BETR | Market cap, enterprise value, 52-week range, price snapshot, debt/cash snapshot |
| CNN Business coverage of former executive lawsuit | Governance/reputation risk; Better denial |
| Business Insider coverage of former COO allegations | Governance/reputation risk; alleged financial opacity |
| HousingWire/Yahoo coverage of 2024 Garg verdict | Separate founder litigation/reputation risk |
Section 1: Summary of the Opportunity
Better Home & Finance Holding Co is a public AI/digital mortgage and home-finance company trading on Nasdaq under BETR. The company originated as Better.com and now positions itself as an “AI-native” mortgage and home-equity finance platform built around Tinman, its mortgage workflow platform, and Betsy, its AI loan assistant. The opportunity is obvious: U.S. mortgage origination is a multi-trillion-dollar market, the traditional process remains slow and costly, and Better’s Q4 2025 and preliminary Q1 2026 disclosures show funded loan volume recovering faster than the industry. The problem is equally obvious: Better is still deeply loss-making, levered, dilutive, founder-risk heavy, and competing in one of the most brutal red-ocean financial-services markets in the U.S.
| Field | Detail |
|---|---|
| Company | Better Home & Finance Holding Co |
| Ticker | NASDAQ: BETR; warrants: BETRW |
| Sector | Mortgage finance / fintech / home-finance platform |
| Core products | Digital mortgage origination, refinance, home equity, mortgage platform technology, AI workflow tools; crypto/token-backed mortgage waitlist product |
| Platform claims | Tinman enables rate options in seconds, pre-approval in minutes, and closing in as little as three weeks; Betsy is a voice-based AI loan assistant, per Better investor overview |
| Cumulative scale claim | Better says it is the first fintech to fund more than $100B in loan volume, per Better investor overview |
| FY2025 revenue | $164.9M, from SEC XBRL in FY2025 Form 10-K |
| FY2025 net loss | $165.9M, from SEC XBRL in FY2025 Form 10-K |
| Q4 2025 funded loan volume | $1.5B, up 56% YoY, per Q4 2025 results |
| Preliminary Q1 2026 funded loan volume | $1.64B, up 89% YoY, per Q1 2026 preliminary update |
| Public-market snapshot | Price $41.57, market cap about $684M, EV about $1.20B, 52-week range $10.81-$94.06, from Yahoo Finance BETR snapshot captured May 5, 2026 |
| Investment recommendation | Pass / watchlist until adjusted EBITDA breakeven, non-dilutive runway, Tinman unit economics, and crypto-collateral product economics/risk controls are proven |
Executive summary: BETR is a high-beta mortgage-fintech turnaround with a credible large-market story and improving 2026 volume momentum, but current public evidence does not yet support an invest recommendation. One correction to the initial framing: Better does have a crypto-adjacent product initiative. Its public website markets a Coinbase-linked token-backed mortgage waitlist where borrowers can pledge Bitcoin or USDC instead of selling crypto for a down payment. That is not the same as BETR being a crypto treasury, exchange, miner, or blockchain company, and the FY2025 10-K and 2026 proxy reviewed here contain no crypto-risk disclosure hits. It is best treated as an early/coming-soon mortgage-product extension and regulatory/collateral-risk item, not as the current core investment thesis. The company is asking investors to underwrite a transition from loss-making originator to AI-native platform before the recurring economics, capital intensity, governance risk, and now crypto-collateral product controls have been de-risked. The correct posture is watchlist, not fresh capital.
Section 2: Market Opportunity Analysis
TAM / SAM / SOM
| Market layer | Estimate | Evidence quality | Comment |
|---|---|---|---|
| TAM: U.S. single-family mortgage originations | $2.2T forecast for 2026 | Strong | MBA forecasts total single-family originations rising 8% from $2.0T in 2025 to $2.2T in 2026, with $1.46T purchase and $737B refinance volume, per MBA forecast |
| SAM: digitally addressable mortgage origination / embedded home finance | Large but not independently quantified here | Moderate | Better can address direct-to-consumer, partner, broker, and embedded-finance channels; share is constrained by licenses, warehouse capacity, partner integrations, pull-through, and margins |
| SOM: Better near-term funded loan volume | Roughly $6B annualized based on Q4 2025 and preliminary Q1 2026 run-rate | Strong for current run-rate; weak for sustainability | Q4 funded volume was $1.5B and preliminary Q1 2026 was $1.64B; run-rate is meaningful but still tiny versus the national market |
Growth trajectory
The market setup has turned less hostile but is not easy. MBA expects originations to grow in 2026, but it also flags elevated origination costs and weaker application-to-closing pull-through. That matters directly to Better: the company’s thesis depends not merely on volume recovery, but on reducing conversion friction and cost-to-close using AI and workflow automation.
Market red flags
- Better’s addressable market is enormous, but the investable share is much smaller than the TAM slide would suggest.
- Mortgage volumes are macro-sensitive: rates, housing supply, employment, affordability, and refinance waves drive results.
- Technology advantage is not self-proving. The real market question is whether Tinman reduces cost per funded loan enough to create durable margin advantage, not whether the mortgage process is broken.
Section 3: SWOT Analysis
| Strengths | Weaknesses |
|---|---|
| Large market exposure: MBA forecasts $2.2T in 2026 U.S. single-family originations, giving Better an enormous volume pool to attack. MBA forecast | Still loss-making at scale: FY2025 revenue was $164.9M while net loss was $165.9M, per SEC XBRL in the FY2025 Form 10-K. |
| Volume momentum: Q4 2025 funded loan volume rose 56% YoY to $1.5B and preliminary Q1 2026 rose 89% YoY to $1.64B. Q4 results, Q1 update | Balance-sheet fragility: yfinance snapshot showed about $104M cash and $622M debt; Better also raised equity in April 2026. Yahoo Finance BETR, Q1 update |
| Tinman distribution proof points: Tinman AI Platform funded loan volume reached $646M in Q4 2025, 44% of total funded loan volume. Q4 results | Founder/governance overhang: Public reporting covers former executive allegations that Better denied, plus a separate 2024 verdict against Garg. CNN, HousingWire/Yahoo |
| Opportunities | Threats |
| Embedded mortgage distribution: Credit Karma, Coinbase, Finance of America, and potential bank/non-bank integrations could make Better more platform-like. Better also markets a Coinbase-linked crypto/token-backed mortgage waitlist. Q4 results, Better crypto-backed mortgages | Red-ocean competition: Rocket, UWM, loanDepot, Pennymac, Mr. Cooper, brokers, banks, and software vendors all attack adjacent pools. Crypto-backed mortgage products add differentiation, but also add regulatory/collateral complexity. |
| Cost restructuring: At least $25M annualized cost reductions beginning Q2 2026 could narrow losses. Q1 update | Dilution risk: April 2026 equity offering was needed despite improving volume, which tells you cash generation is not yet self-sustaining. |
| Rates/volume recovery: A rising origination market can lift all boats if Better converts volume efficiently. MBA forecast | Regulatory and capital-market risk: Mortgage lenders rely on licensing, compliance, secondary-market access, warehouse lines, and investor confidence. |
Section 4: Competitive Landscape
| Competitor / category | Positioning | Better implication |
|---|---|---|
| Rocket Mortgage / Rocket Companies | Scaled retail mortgage originator with brand, servicing, technology, and consumer funnel | Better’s AI speed story must overcome Rocket’s scale and brand advantage |
| United Wholesale Mortgage | Dominant wholesale channel lender | Better is disadvantaged if brokers prefer UWM’s pricing, workflow, and relationships |
| loanDepot / Pennymac / Mr. Cooper | Large originator-servicer platforms | Better lacks the same public proof of servicing income ballast and mature scale |
| Banks and credit unions | Deposit-funded customer relationships and regulated trust | Better may win on speed, but banks own customer relationships and cost of capital advantages |
| Blend / mortgage software vendors | Technology layer for mortgage workflows | Tinman’s B2B/platform opportunity competes with incumbents and build-vs-buy by large lenders |
| Embedded-finance partners | Credit Karma, Coinbase, Finance of America-style distribution | Opportunity if Better is the processor behind partner demand; risk if partners commoditize it |
Intensity assessment: Red Ocean. Better is not entering an empty category. It is trying to use AI workflow automation and partner distribution to take share in a massive but mature mortgage market where incumbents have scale, capital, servicing assets, and distribution. Tinman may be differentiated, but the moat is not yet externally proven.
Section 5: Risk Analysis
| Severity | Category | Description | Likelihood | Impact | Mitigation / diligence trigger |
|---|---|---|---|---|---|
| Critical | Profitability | FY2025 net loss exceeded revenue; Q4 2025 still showed ~$40M net loss and $24M adjusted EBITDA loss. | High | High | Require at least two quarters proving adjusted EBITDA breakeven or positive contribution margin with volume growth. |
| Critical | Capital / dilution | April 2026 offering targeted $60M plus possible $9M over-allotment; cash target after close about $130M. | Medium | High | Track cash balance, warehouse capacity, and any additional equity issuance. |
| Critical | Founder / governance | Public allegations and verdict coverage create reputational/counterparty risk. Better denied former executive claims, but the overhang remains. | Medium | High | Look for governance hardening, independent board leadership, low executive turnover, and litigation resolution. |
| High | Macro / rates | Mortgage volume depends on rates, affordability, housing supply, and refinance cycles. | High | High | Stress test funded volume at flat/high-rate scenarios. |
| High | Competitive pricing | Scaled competitors can pressure margins and customer acquisition cost. | High | Medium | Track gain-on-sale margins, cost per funded loan, and partner economics. |
| High | Warehouse / secondary market | Mortgage lending requires capital-market access and reliable loan sales. | Medium | High | Monitor 10-Q risk factors, covenant disclosures, and warehouse line renewals. |
| Medium | Technology claims | Tinman may improve speed without creating durable moat or software-like margins. | Medium | Medium | Require recurring B2B revenue, platform take-rate, cost-to-close, and retention metrics. |
| Medium | Regulatory | Mortgage lending is highly regulated across states and product categories. | Medium | Medium | Monitor enforcement actions, complaint data, licensing disclosures, and compliance staffing. |
| Medium | Crypto-collateral product | Better markets a coming-soon Coinbase-linked token-backed mortgage where borrowers pledge Bitcoin or USDC for a down-payment loan. This could widen distribution to crypto holders, but creates custody, disclosure, collateral-liquidation, consumer-protection, volatility, and Fannie Mae/underwriting-compliance questions. | Medium | Medium | Treat as unproven optionality until management discloses launch timing, volume, revenue model, collateral controls, custody/legal structure, default/liquidation process, and regulatory treatment. |
| Medium | U.K. bank sale | Better classified its U.K.-based bank as held for sale effective Q1 2026. | Medium | Medium | Verify completion, proceeds, and removal of stranded costs. |
Section 6: Team Evaluation
| Person / group | Verified background | Assessment |
|---|---|---|
| Vishal Garg, CEO / founder | Founded Better and has served as CEO since inception; 2026 proxy says he previously founded 1/0 Capital and holds a BS from NYU. 2026 Proxy | Product vision and persistence are real; founder-reputation and litigation history materially impair score. |
| Harit Talwar, Chair | Former Goldman Sachs consumer business leader and Marcus builder; board roles include Mastercard, per 2026 Proxy. | Strong financial-services governance asset. |
| Loveen Advani, CFO | Better announced Advani as CFO in 2026; company described him as a strategic and operational finance leader. Better CFO announcement | New CFO must prove capital discipline and reporting credibility quickly. |
| Board | Includes David Barse, Michael Farello, Hugh Frater, Arnaud Massenet, Bhaskar Menon, Prabhu Narasimhan, Harit Talwar, Vishal Garg. 2026 Proxy | Board has credible names; governance discount remains because founder control/reputation issues are central. |
Credibility score: 2.5/5. Better has credible operators and board members, but team score is capped by unusually visible founder/governance baggage for a regulated consumer-finance company.
Section 7: Financial and Valuation Assessment
Financial snapshot
| Metric | Value | Source / calculation |
|---|---|---|
| FY2025 revenue | $164.9M | SEC XBRL from FY2025 Form 10-K |
| FY2025 net loss | $165.9M | SEC XBRL from FY2025 Form 10-K |
| FY2025 net margin | approximately -101% | Calculated from SEC XBRL revenue and net loss |
| FY2025 assets | $1.505B | SEC XBRL from FY2025 Form 10-K |
| FY2025 liabilities | $1.468B | SEC XBRL from FY2025 Form 10-K |
| FY2025 stockholders' equity | $37.2M | SEC XBRL from FY2025 Form 10-K |
| Market cap | about $684M | Yahoo Finance BETR snapshot, May 5, 2026 |
| Enterprise value | about $1.20B | Yahoo Finance BETR snapshot, May 5, 2026 |
| Market cap / FY2025 revenue | about 4.1x | Calculated |
| EV / FY2025 revenue | about 7.3x | Calculated |
| Cash / debt snapshot | about $104M cash, $622M debt | Yahoo Finance BETR snapshot, May 5, 2026 |
Public-market stock snapshot — hybrid module
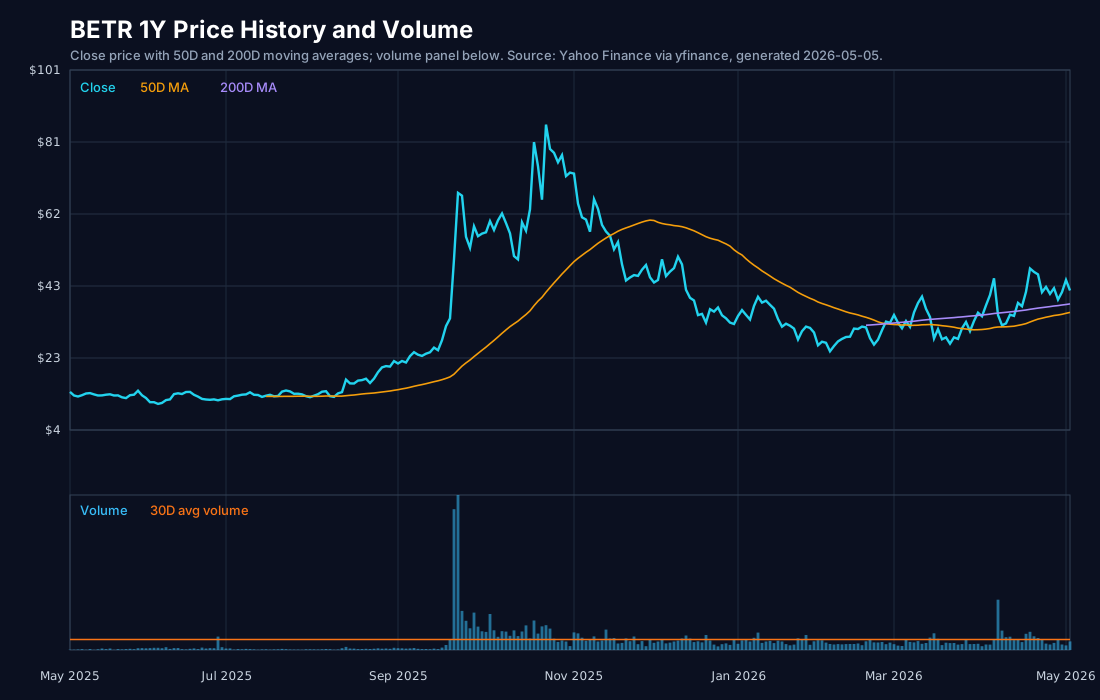
The public-market signal confirms the core watchlist stance: BETR is liquid enough to trade, but the equity is highly volatile and already prices in a meaningful turnaround. Market data snapshot below is from Yahoo Finance BETR via yfinance, generated May 5, 2026 using the last available close on May 4, 2026.
| Metric | BETR snapshot | Investment interpretation |
|---|---|---|
| Last close / current price snapshot | $41.57 | Small-cap equity with sharp post-reverse-split volatility; do not treat price stability as established. |
| Market capitalization | ~$684M | Public equity already assigns meaningful value despite FY2025 losses. |
| Enterprise value | ~$1.20B | Debt-heavy EV makes valuation less forgiving than market cap alone suggests. |
| 52-week range | $10.81 – $94.06 | Extremely wide range; stock remains event-driven/turnaround-sensitive. |
| Beta | 1.85 | Higher volatility than broad market. |
| Shares outstanding / float | ~10.6M / ~8.7M | Thin enough that block movements, short interest, and financing headlines can move the stock. |
| 30D / 90D average volume | ~564k / ~472k shares/day | Reasonable small-cap liquidity but not institutional deep liquidity. |
| 30D average dollar volume | ~$23.4M/day | Tradable for public-market accounts, but position sizing should account for volatility and float. |
| 1M / 3M returns | +10.5% / +54.7% | Momentum has improved materially into the report date. |
| 6M / 1Y returns | -42.5% / +189.3% | The longer chart shows violent swings, not steady compounding. |
| YTD return | +19.7% | Positive YTD move, but not enough to offset the fundamental risks. |
| EV / FY2025 revenue | ~7.3x | Too high for an unprofitable mortgage originator unless Tinman/platform economics are proven. |
| Price / sales | ~4.1x | Premium multiple for a company with FY2025 net loss roughly equal to revenue. |
| Price / book | ~17.9x | High because book equity is thin relative to market capitalization. |
| Short interest / short ratio | ~29.9% of float / 3.6 days | Elevated skepticism and potential squeeze risk; price action may diverge from fundamentals. |
Stock-analysis conclusion: the stock is investable only as a speculative turnaround/AI-platform option, not as a clean public fintech compounder. The chart and liquidity profile support keeping BETR on watchlist, but the valuation multiple and volatility argue against buying before profitability evidence improves.
Valuation view
BETR is expensive if valued as a loss-making mortgage originator and not yet proven if valued as an AI software/platform company. A 7x-plus EV/revenue multiple on negative operating margins requires confidence that Tinman can deliver software-like economics or material operating leverage. The public data does not yet provide that confidence.
Sensitivity
| Scenario | Requirements | Investment implication |
|---|---|---|
| Bull | Q3 2026 adjusted EBITDA breakeven achieved; Tinman mix rises; cost cuts hit; no further dilution | Potential re-rate from distressed mortgage lender to AI-enabled platform |
| Base | Volume grows, losses narrow but persist, platform economics remain opaque | Watchlist only |
| Bear | Rates stay high, partner volumes disappoint, additional capital required, governance controversy resurfaces | Equity downside remains material |
Section 8: Go-to-Market Strategy and Traction
| Traction metric | Evidence | Evidence quality | Comment |
|---|---|---|---|
| Cumulative funded loan volume | Better says it has funded more than $100B in loan volume. Better investor overview | Moderate | Company disclosure; useful scale signal but not current economics. |
| Q4 2025 funded loan volume | $1.5B, up 56% YoY. Q4 results | Strong | Current operating momentum. |
| Preliminary Q1 2026 funded volume | $1.64B, up 89% YoY. Q1 update | Strong but preliminary | Strong early 2026 signal; needs full financials. |
| Tinman AI Platform volume | $646M in Q4 2025, 44% of total funded volume. Q4 results | Strong | Most important platform-transition datapoint. |
| Credit Karma pre-approvals | 30,000+ mortgage pre-approvals in five months; less than 1% of estimated eligible base reached, according to Better. Q4 results | Moderate | Good top-of-funnel datapoint; conversion and profitability not disclosed. |
GTM assessment: Better’s GTM is shifting from pure direct-to-consumer to embedded/partner distribution and AI-enabled platform processing. That is the correct strategic direction, but the investment case needs downstream conversion, margin, CAC, and take-rate disclosure — not just pre-approval counts and headline partnerships.
Section 9: Additional Considerations
- IP / technology: Tinman and Betsy are central to the thesis, but public filings and IR materials do not yet prove a defensible software moat. The right diligence question is whether Better’s AI system materially reduces cost-to-close and error rates at scale.
- Regulatory: Mortgage lending involves state licensing, consumer protection, fair lending, underwriting, disclosures, data privacy, and secondary-market rules. Any AI underwriting/workflow claims should be evaluated against regulatory explainability and compliance standards. Better's crypto/token-backed mortgage waitlist adds another layer: custody of pledged crypto through a Coinbase platform account, consumer disclosure, collateral liquidation after delinquency, tax, and Fannie Mae underwriting constraints all need diligence before assigning value.
- Ethics / consumer trust: AI mortgage tools can improve speed and transparency, but consumer-finance AI creates fairness, explainability, and complaint-risk issues.
- Exit / strategic value: Potential acquirers could include scaled mortgage originators, financial-services technology firms, or embedded-finance platforms, but current losses and governance overhang make strategic M&A less straightforward.
- Crypto exposure clarification: Better does have a crypto-adjacent product initiative: its public site describes token-backed mortgages where borrowers can pledge Bitcoin or USDC, with crypto held in Better Mortgage custody through Coinbase, instead of selling crypto for a down payment. The same page says the product is coming soon / early-access. This is product-level crypto collateral exposure, not evidence that BETR holds crypto treasury assets or operates a crypto exchange/miner/blockchain business.
- Public-market liquidity: BETR is a small-cap, high-volatility stock with a wide 52-week range. This is not a low-volatility compounder.
Section 10: Research and External Validation
Claims supported externally
- U.S. mortgage origination is massive: MBA forecasts $2.2T in 2026 single-family originations. MBA forecast
- Better has current funded-volume momentum: Q4 2025 and preliminary Q1 2026 disclosures show 56% and 89% YoY growth respectively. Q4 results, Q1 update
- Better is still loss-making: FY2025 revenue and net loss are available in SEC filings. FY2025 Form 10-K
- Better has a crypto-adjacent product initiative: its website markets a Coinbase-linked token-backed mortgage waitlist where borrowers can pledge Bitcoin or USDC for a down-payment loan while retaining crypto exposure. Better crypto-backed mortgages
- Founder/governance controversies are externally documented, though Better denied the former executive allegations. CNN, Business Insider
Claims contradicted or not yet proven
- “AI-native platform economics” are not yet proven by public financials. The company discloses volume and platform mix, but not enough cost-to-close, recurring software revenue, or partner take-rate detail.
- “Clear line of sight to breakeven” remains management guidance, not audited performance. Q4 2025 still showed a $24M adjusted EBITDA loss.
- “Differentiated moat” remains plausible but not demonstrated against Rocket, UWM, bank, broker, and software competitors. The crypto-backed mortgage concept is differentiated, but public evidence does not yet show launch volume, contribution economics, regulatory approvals, default behavior, or consumer demand conversion.
Information gaps
- CAC by channel, especially partner vs. direct-to-consumer.
- Contribution margin by product and channel.
- Tinman software revenue, take-rate, and gross margin.
- Pull-through from Credit Karma pre-approval to funded loan.
- Warehouse line terms and covenant sensitivity.
- Customer-level retention/repeat-use economics.
- Complaint, regulatory, and fair-lending metrics for AI-assisted workflows.
- Launch status, economics, collateral policy, custody/legal structure, regulatory treatment, and delinquency/liquidation data for the token-backed mortgage product.
Section 11: Investment Recommendation
Verdict: Pass / Watchlist ❌ Confidence: Medium Score: 43/100
Top 3 reasons to pass now
- Losses remain too large: FY2025 net loss was roughly equal to revenue, and Q4 2025 still had a ~$40M net loss.
- Capital structure is fragile: Debt is high relative to cash, stockholders' equity is thin, and the company raised equity in April 2026.
- Governance/founder risk is unusually material: The CEO’s public controversy and litigation history is a real counterparty and valuation overhang.
Top 3 reasons to keep it on watchlist
- Volume momentum is real: Q4 2025 and preliminary Q1 2026 funded loan volume materially outgrew the industry backdrop.
- Tinman could become valuable if economics prove out: 44% Tinman volume mix in Q4 2025 is the key datapoint to monitor.
- Market backdrop is improving: MBA expects the U.S. origination market to grow in 2026.
DD questions before reconsidering
- What is Tinman revenue, gross margin, and contribution margin separately from direct origination?
- What is cost per funded loan by channel?
- What is Credit Karma pre-approval-to-funded-loan conversion?
- What are current warehouse capacity, covenants, and weighted funding costs?
- What share of Q1 2026 volume came from one or two partners?
- Does the company hit adjusted EBITDA breakeven by end-Q3 2026 without another capital raise?
- What is the full impact of the U.K. bank sale on cash, regulatory capital, and stranded costs?
- How are AI underwriting/workflow decisions audited for compliance and fair-lending risk?
- What is the launch timetable, expected volume, revenue model, custody structure, collateral haircuts, default/liquidation process, and regulatory treatment for the crypto/token-backed mortgage product?
- What is the status and expected exposure from founder/company litigation?
- What governance changes, if any, reduce key-person risk around Garg?
Next step
Do not buy on partnership headlines. Re-evaluate after Q2/Q3 2026 results, specifically looking for simultaneous improvement in funded volume, contribution margin, cash burn, Tinman mix, and adjusted EBITDA.
Section 12: Cap Table Analysis & Dilution Modeling
Better is a public company, so the available cap-table evidence is substantially better than for most private deals: the 2026 proxy provides share-class counts, voting rights, 5% holders, director/officer beneficial ownership, and several look-through footnotes. The caveat is that beneficial-ownership tables can include shares issuable on conversion, warrants, options, or RSUs exercisable/vesting within 60 days; the table below therefore uses the proxy's disclosed presentation rather than pretending it is a fully reconciled transfer-agent ledger.
Public share-class structure as of the April 15, 2026 record date
| Security class | Shares outstanding | Voting rights | Conversion / economic note | Investment implication |
|---|---|---|---|---|
| Class A common stock | 13,083,708 | 1 vote/share | Publicly traded common stock. | Main public float/economic security. |
| Class B common stock | 4,347,549 | 3 votes/share | Convertible 1:1 into Class A at holder option. | Concentrates voting power in legacy/founder/insider holders. |
| Class C common stock | 1,437,545 | No voting rights | Convertible 1:1 into Class A at holder option. | Non-voting legacy/economic class; heavily tied to SoftBank-linked structures. |
| Approximate voting base | 26,126,355 votes | Class A votes plus 3x Class B votes | Class C excluded from voting. | Public Class A holders have materially less voting influence than their economic share count may suggest. |
Source: Better 2026 Proxy Statement.
5% holders and major control blocks disclosed in the 2026 proxy
| Holder / group | Proxy-disclosed Class A beneficial ownership | Class B beneficial ownership | Class C beneficial ownership | Proxy class ownership | Approx. overall ownership, as-converted / beneficial basis* | Approx. voting power using disclosed A/B counts** | Look-through / interpretation |
|---|---|---|---|---|---|---|---|
| Vishal Garg | 1,975,843 | 1,910,966 | — | 13.2% of Class A; 40.4% of Class B | ~20.6% | ~29.5% | Founder/CEO remains the single most important voting actor. Footnote details include direct Class A, direct Class B, Class B through 1/0 Real Estate LLC, The 718 4Ever Trust I, 1/0 Holdco LLC, and 387,137 Class B shares underlying exercisable options. |
| BHFHC Distribution Trust | 1,300,000 | — | 1,300,000 | 9.0% of Class A; 90.4% of Class C | ~13.8% | ~5.0% | Trust account designated for the benefit of SB Northstar LP, beneficial acquisition subject to regulatory approvals or confirmation no approvals are needed; SoftBank Group relationships create shared beneficial-ownership attribution. |
| Entities and persons affiliated with Vance Spencer / Framework | 1,199,762 | — | — | 9.2% of Class A | ~6.4% | ~4.6% | Based on April 2026 Schedule 13G; includes Framework Ventures IV LP, Framework GP, Framework Management, Framework Labs, Vance Spencer and Michael Anderson control relationships. |
| Entities affiliated with Steven Sarracino / Activant | 1,298,331 | 1,298,331 | — | 9.0% of Class A | ~13.8% | ~19.9% | Proxy describes Class A amount as obtainable on conversion of Class B held across Activant entities and Better Voyager Partners. Meaningful legacy venture block with high-vote exposure. |
| Entities affiliated with SoftBank Group Corp. | 1,254,813 | 137,545 | 475,215 | 9.2% of Class A; 33.1% of Class C | ~9.9% | ~6.4% | Includes SVF II Beaver holdings and 13,500 Class A shares issuable on SB Northstar warrants; SoftBank/Silver Brick/SB Northstar relationships remain embedded in ownership structure. |
| Frontier Capital Management Co., LLC | 877,822 | — | — | 6.7% of Class A | ~4.7% | ~3.4% | Institutional Class A holder; sole voting power over 402,918 shares and dispositive power over 877,822 shares per proxy footnote. |
| Novator Capital Sponsor Ltd. / Thor Björgólfsson | 659,446 | — | — | 5.0% of Class A | ~3.5% | ~2.5% | Includes 613,396 Class A shares and 46,050 Class A shares issuable on warrants; SPAC-sponsor legacy position. |
| All Better directors and executive officers as a group, 13 people | 2,597,454 | 2,234,123 | — | 16.9% of Class A; 43.1% of Class B | ~25.6% | ~35.6% | Insider group controls more than one-third of approximate votes using disclosed A/B counts, with most of the power coming from Class B. |
*Approximate overall ownership is Cipher Research math using disclosed beneficial Class A + Class B + Class C shares divided by total Class A+B+C shares outstanding at the proxy record date, or 18,868,802 shares. It is directional, not a transfer-agent cap table, because SEC beneficial ownership can include shares issuable upon conversion/exercise/vesting and overlapping control relationships.
**Approximate voting power is Cipher Research math using the proxy-disclosed beneficial Class A and Class B counts divided by the record-date voting base of 26,126,355 votes. It is directional, not a company-disclosed voting-power percentage, because the proxy's beneficial-ownership columns can include convertible or exercisable securities and are not a full pro-forma capitalization table.
Additional insider / officer ownership details
| Person | Proxy-disclosed Class A | Proxy-disclosed Class B | Interpretation |
|---|---|---|---|
| Chad Smith | 28,516 | — | Less than 1%; includes trust-held shares and RSUs vesting within 60 days. |
| Paula Tuffin | 37,907 | — | Less than 1%. |
| David Barse | 10,389 | — | Less than 1%; RSUs vesting within 60 days. |
| Michael Farello | 11,327 | — | Less than 1%; RSUs vesting within 60 days. |
| Hugh R. Frater | 1,176 | — | Less than 1%; RSUs vesting within 60 days. |
| Bhaskar Menon | 14,478 | — | Less than 1%; includes shares and RSUs. |
| Arnaud Massenet | 76,670 | — | Less than 1%; includes shares, warrants and RSUs. |
| Prabhu Narasimhan | 71,242 | — | Less than 1%; includes direct/indirect shares, warrants and RSUs. |
| Harit Talwar | 89,593 | 46,760 | Less than 1% of Class A; 1.1% of Class B; chairman has some high-vote exposure but far below Garg/Activant scale. |
Capital-structure implications
- Control is not dispersed like a normal public-company float. Garg's proxy-disclosed Class B exposure gives him roughly 29.5% directional voting power, while directors and executive officers as a group are roughly 35.6% on the same basis.
- Legacy venture/SPAC holders still matter. Activant/Sarracino, SoftBank, Framework/Vance Spencer, BHFHC Distribution Trust and Novator remain visible in the 5% holder table.
- Class C is almost entirely concentrated. BHFHC Distribution Trust accounts for 90.4% of Class C and SoftBank-affiliated entities account for 33.1% of Class C in the proxy presentation; because Class C has no vote but converts 1:1 into Class A, it is economically relevant but governance-light until conversion.
- Dilution risk is still active. Better announced a $60M Class A common-stock offering plus up to $9M over-allotment in April 2026. That means the proxy record-date table is useful for governance/control, but investors should expect the economic capitalization to move as financing closes and if losses continue.
- Public float quality is mixed. There is real public-company disclosure, but the mix of multi-class shares, conversion mechanics, warrants, RSUs/options, legacy trusts and related investment vehicles makes BETR harder to underwrite than a single-class small-cap lender.
Public-market dilution modeling
| Exit / valuation scenario | Equity value | Implication for current holders |
|---|---|---|
| $50M | $50M | Severe downside; below current market cap and likely distressed. |
| $100M | $100M | Severe downside; implies capital-market confidence broken. |
| $500M | $500M | Still below the captured ~$684M market cap snapshot; dilution and losses could absorb upside. |
| $1B+ | $1B+ | Requires credible breakeven and market confidence in Tinman/platform economics. |
For a public small-cap with continuing losses, the relevant dilution question is not a private waterfall; it is whether BETR can avoid repeated equity issuance before profitability. April 2026 tells us that question is not resolved.
Section 13: Founder Deep-Dive
Vishal Garg
Garg founded Better and remains CEO and director. The 2026 proxy describes him as founder and CEO of Better since inception and founding partner of 1/0 Capital since 1999. 2026 Proxy
Positives
- Founder-led company with a decade-plus of category focus.
- Demonstrated ability to raise capital, survive SPAC/de-SPAC turbulence, and keep the company operating through a brutal mortgage cycle.
- Product vision is coherent: mortgage workflows are genuinely slow, expensive, and ripe for automation.
Red flags
- CNN reported a former executive lawsuit alleging Garg misled investors and retaliated; Better denied the allegations and said it believed the claims were without merit. CNN coverage
- Business Insider reported former COO allegations that financials were kept a “black box” and that she was pushed out after raising concerns. Business Insider coverage
- HousingWire/Yahoo reported a New York jury found Garg liable for breach of fiduciary duty and conversion in a separate decade-long lawsuit involving EIFC, with $5.5M damages ordered and an intended appeal. HousingWire/Yahoo coverage
Co-founder / key-person stability
The report does not identify a current equal co-founder operating partner alongside Garg. Noam Wasserman’s founder research is a useful reminder that 24% of two-founder teams lose a founder by year four; here the more relevant risk is single-founder concentration and governance dependence rather than two-founder breakup.
Founder assessment: Garg is both the reason Better exists and a central reason the equity deserves a governance discount.
Section 14: Quantitative Scoring Model
| Dimension | Weight | Score | Weighted contribution | Rationale |
|---|---|---|---|---|
| Team | 25% | 4 | 10.0 | Founder/product depth and credible board offset by severe founder/governance baggage. |
| Market | 20% | 8 | 16.0 | Massive mortgage TAM with 2026 origination recovery forecast. |
| Traction | 20% | 5 | 10.0 | Funded volume and Tinman mix improving, but profitability and software economics remain unproven. |
| Financials | 15% | 2 | 3.0 | FY2025 net loss approximately equals revenue; high leverage; fresh equity raise. |
| Competitive | 10% | 3 | 3.0 | Red-ocean mortgage market with powerful incumbents and unclear moat. |
| Risk Profile | 10% | 1 | 1.0 | Macro, regulatory, capital, dilution, warehouse, and governance risks stack together. |
| Total | 100% | 43.0 | Below 50 = Pass. |
Formula: total = (team × 2.5) + (market × 2.0) + (traction × 2.0) + (financials × 1.5) + (competitive × 1.0) + (risk × 1.0)
Interpretation: 43/100 is a pass. The market is large and the traction is improving, but financials and risk profile dominate the score.
Section 15: Stage-Specific Benchmarking
BETR is public, not seed/Series A/Series B. The stage benchmarks below are still useful because BETR wants investors to treat Tinman partly like a technology platform, but its financial profile does not yet resemble a mature public fintech/SaaS business.
| Benchmark | Median reference | BETR comparison | Assessment |
|---|---|---|---|
| Seed ARR | $100K ARR | FY2025 revenue $164.9M | Revenue scale far beyond startup benchmarks |
| Series A ARR | $1.5M ARR | FY2025 revenue $164.9M | Scale is not the issue |
| Series B ARR | $8M ARR | FY2025 revenue $164.9M | Again, scale is not the issue |
| Series A gross margin | 70% | yfinance gross margin field shows 100%, but mortgage revenue accounting is not comparable to SaaS gross margin | Not useful without channel contribution margin |
| LTV/CAC | >3x good | Not disclosed | Missing; must be a diligence condition |
| NDR | 115% Series B median | Not disclosed | Not applicable / missing for mortgage origination; relevant only for Tinman B2B contracts |
| Burn multiple | >3x deal killer reference | FY2025 net loss roughly equals FY2025 revenue | Unacceptable for a public company unless breakeven is imminent |
Benchmark conclusion: BETR’s problem is not early-stage scale; it is public-company quality. A company with $165M revenue, negative ~101% net margin, equity dilution, and founder governance risk should not receive a SaaS/platform premium until Tinman economics are separated and proven.
Section 16: Comparable Transactions Analysis
| Company / transaction | Stage | Round / transaction size | Valuation / market value | Revenue multiple | Key investors / parties | Date | Relevance |
|---|---|---|---|---|---|---|---|
| Better de-SPAC with Aurora Acquisition | Public listing | SPAC merger originally announced at multi-billion valuation; completed after delays | Current market cap snapshot about $684M | About 4.1x FY2025 revenue | Better, Aurora, legacy investors including SoftBank-linked holders | 2023 public listing; 2026 snapshot | Shows major valuation compression and public-market reset |
| Better April 2026 public offering | Public follow-on | $60M plus up to $9M over-allotment | Offering price disclosed as discount to 30-day VWAP | Not meaningful | Public equity investors | 2026 | Current dilution/capital need evidence |
| Rocket Companies | Public mortgage platform | Public company | Public large-cap mortgage platform | Varies with cycle | Public shareholders | Current | Scaled incumbent benchmark for brand, servicing, and distribution |
| United Wholesale Mortgage | Public wholesale lender | Public company | Public scaled wholesale originator | Varies with cycle | Public shareholders | Current | Scaled wholesale benchmark; demonstrates Better is not in a winner-take-all market |
| Blend Labs | Public mortgage/consumer-banking software platform | Public company | Public fintech software company | Varies by recurring revenue and growth | Public shareholders | Current | Closest software/platform comp, but Better has materially more balance-sheet/origination exposure |
Comparable-transaction conclusion: The cleanest comps are public-market comparables, not private SaaS rounds. BETR should be compared against mortgage originators for risk and against software platforms only for the Tinman portion. Public investors should not pay platform multiples for the whole company until the platform revenue/margin split is disclosed.
Section 17: Unit Economics Deep-Dive
| Metric | Reported / derived status | Assessment |
|---|---|---|
| CAC | Not disclosed by channel | Critical missing metric; partner CAC and DTC CAC likely differ materially. |
| LTV | Not disclosed | Mortgage customers are episodic; servicing/recapture economics would matter if retained. |
| LTV/CAC ratio | Not disclosed | Cannot underwrite as high-quality fintech without this. |
| Payback period | Not disclosed | Must be measured by partner, DTC, broker, and product. |
| Gross margin | yfinance field shows 100%, but mortgage-finance accounting makes this non-comparable to SaaS | Need contribution margin after fulfillment, credit, funding, sales, and partner costs. |
| Burn multiple | FY2025 net loss roughly equals FY2025 revenue | Bad. Public company is still consuming capital heavily. |
| Net dollar retention | Not disclosed / not directly applicable to origination | Relevant only if Tinman becomes recurring B2B software. |
| Magic Number | Not disclosed / not calculable from public data | Need sales and marketing spend plus net new recurring revenue; not available. |
| Contribution margin | Not adequately disclosed by channel | The key missing unit-economic proof point. |
Bottom line on unit economics
BETR’s unit economics are not yet investment-grade from public disclosures. Funded volume is improving, but the market needs proof that incremental volume is profitable after acquisition, fulfillment, funding, partner, credit, and compliance costs. Until then, Better remains a speculative turnaround dressed in an AI-platform narrative.
Final Recommendation
Pass / watchlist. BETR has enough momentum to monitor closely, but not enough verified operating leverage to buy. The investable inflection is not a press release about AI or a new partnership. It is a reported quarter where funded volume, Tinman mix, contribution margin, cash burn, and adjusted EBITDA all improve together without new dilution.
Public-Market Appendix: BETR Stock Analysis
This appendix implements the public-company hybrid reporting module: key implications are integrated into Section 7, while the detailed stock chart and trading-data table sit here without changing the mandatory Sections 1–17. Market data source: Yahoo Finance BETR via yfinance, generated May 5, 2026 using the last available close on May 4, 2026.
| Public-market metric | Value | Comment |
|---|---|---|
| Last close | $41.57 | Snapshot date May 4, 2026. |
| 52-week low / high | $10.81 / $94.06 | Range confirms extreme historical volatility. |
| Last trading volume | 464,600 shares | Near recent average. |
| 10D average volume | ~452,000 shares/day | Short-term liquidity baseline. |
| 30D average volume | ~564,000 shares/day | Useful for position-sizing; liquidity is real but not large-cap depth. |
| 90D average volume | ~472,000 shares/day | Confirms small-cap liquidity profile. |
| 1Y average volume | ~459,000 shares/day | Not illiquid, but susceptible to headline-driven gaps. |
| 30D average dollar volume | ~$23.4M/day | Tradable, but large orders would still need care. |
| 1M return | +10.5% | Recent momentum positive. |
| 3M return | +54.7% | Strong medium-term rally into report date. |
| 6M return | -42.5% | Rally does not erase broader volatility. |
| 1Y return | +189.3% | Large move from depressed base; interpret alongside 52-week drawdown risk. |
| YTD return | +19.7% | Positive, but still event-driven. |
| Market cap / enterprise value | ~$684M / ~$1.20B | EV is much higher than market cap because debt is material. |
| EV / FY2025 revenue | ~7.3x | Demands significant operating improvement. |
| Price / sales | ~4.1x | Rich for a business with FY2025 net loss roughly equal to revenue. |
| Price / book | ~17.9x | Reflects thin book equity. |
| Short interest / short ratio | ~29.9% of float / 3.6 days | High short interest creates squeeze risk and confirms skepticism. |
Trading conclusion: BETR is not a sleepy value stock. It is a high-beta, heavily shorted, headline-sensitive turnaround security. The right underwriting posture is to wait for hard quarterly evidence — funded volume growth plus margin/cash-burn improvement — rather than buy solely because the chart has rallied.