Nintendo Co., Ltd. (7974.T / NTDOY) — Public Investment Analysis
Cipher Research score: 77/100 Verdict: Invest with Conditions / Watchlist Buy on Weakness ⚠️ Confidence: Medium Analyst: Cipher Research Date: May 11, 2026 Report type: Public-company hybrid public-market report
Sources Reviewed
- Nintendo FY2026 consolidated results
- Nintendo FY2026 financial results explanatory material
- Nintendo FY2025 annual report
- Nintendo dedicated video game sales units
- Nintendo Switch 2 official announcement
- BCG Video Gaming Report 2026
- Circana 2026 U.S. video-game forecast
- Yahoo Finance chart API snapshot captured locally for 7974.T and NTDOY on May 11, 2026.
- CNBC: Nintendo hikes Switch 2 prices and expects console sales to decline as memory crunch bites
- GamesIndustry.biz: Nintendo hikes Switch 2 prices, revises console costs in Japan, US, Canada, and Europe
- Reuters: Nintendo shares slump as price hikes, games shortfall spook market
- Goldman Sachs sell-side commentary by Minami Munakata, commentary provided to Cipher Research on May 11, 2026.
Recent Market Update — Price Hikes, Outlook Miss and Stock Slump
This report has been revised to explicitly incorporate the May 2026 market reaction that should have been front-and-center in the first version. The negative news cluster is real: Nintendo raised Switch 2 pricing across major markets, guided FY2027 net sales down year over year, missed sell-side expectations, and the stock sold off sharply.
| Recent item | Verified evidence | Cipher interpretation |
|---|---|---|
| Switch 2 U.S. price hike | CNBC reported Nintendo will raise the U.S. Switch 2 price from $449.99 to $499.99 from Sept. 1, 2026; GamesIndustry.biz separately reported U.S., Canada, Europe and Japan revisions. | Price elasticity is now a live underwriting risk, not a theoretical one. |
| Japan price hike | GamesIndustry.biz reported the Japan-only Switch 2 system rises from ¥49,980 to ¥59,980 from May 25, 2026. | The yen/local-market optics matter because Nintendo historically protects accessibility. |
| Cost pressure | CNBC reported Nintendo cited market conditions and a roughly ¥100B FY2027 impact from rising component prices, particularly memory, and tariff measures. | Hardware margin risk is material enough to change the score, even if the long-term IP moat remains intact. |
| Outlook miss | CNBC reported FY2027 guidance of ¥2.05T net sales and ¥310B parent profit, below LSEG expectations of ¥2.46T and ¥418.5B. | This is the main reason the recommendation is no longer framed as a clean 80+ “strong invest.” |
| Goldman Sachs update | Goldman Sachs, in commentary by Minami Munakata provided to Cipher Research, kept a Buy rating but lowered its 12-month target price to ¥10,500 from ¥12,300 and cut FY3/27–FY3/30 operating-profit estimates by 9%–31% after the 4Q miss and soft guide. GS cited FY3/27 operating-profit guidance of ¥370B, a roughly ¥100B component/tariff cost hit, and a lower Switch 2 hardware shipment assumption of 16.5M units. | This triangulates the core thesis: the near-term estimate reset is real, but credible sell-side work still sees upside if the active-console base reaches record highs as exclusive software expands. |
| Share-price reaction | Reuters reported Nintendo shares fell about 8% in Tokyo as price hikes and a perceived software/games shortfall spooked the market; the Yahoo chart snapshot shows 7974.T closed at ¥7,179 on May 11, 2026 after 21.0M shares traded. | The slump improves entry price but confirms market concern around second-year Switch 2 momentum and attach-rate quality. |
Revised conclusion: Nintendo remains investable, but the right conclusion is Invest with Conditions / Watchlist Buy on Weakness, not an unqualified strong-invest call. The score is reduced from 80 to 77/100 to reflect the outlook miss, price-hike elasticity risk, and near-term stock-pressure signal. Goldman’s maintained Buy rating and ¥10,500 target are supportive, but the target cut and 9%–31% operating-profit estimate reductions reinforce that the buy case now depends on post-hike demand and software attach, not blind confidence in the launch cycle.
Section 1: Summary of the Opportunity
Nintendo is one of the world’s most durable entertainment/IP companies: an integrated hardware, software, services, and character platform built around franchises such as Mario, Zelda, Pokémon, Animal Crossing, Donkey Kong, Kirby, and Splatoon. The investment question is whether the Switch 2 cycle plus digital/IP monetization justify owning the public equity after a sharp share-price reset. The answer is yes, selectively, but only with tighter entry discipline after the May 2026 price-hike/outlook shock. FY2026 proved product-market demand for Switch 2, with 19.86M hardware units and 48.71M software units sold in the fiscal year, while consolidated net sales nearly doubled to ¥2.313T and parent profit rose to ¥424.1B according to Nintendo FY2026 results. The catch: Nintendo is still cyclical, FY2027 guidance implies lower sales, CNBC-reported consensus expectations were materially higher than guidance, and the market is now actively punishing the price-hike/software-cadence risk. Goldman Sachs commentary by Minami Munakata, provided to Cipher Research, is directionally consistent with this: GS maintained Buy but lowered its 12-month target to ¥10,500 from ¥12,300 after cutting FY3/27–FY3/30 operating-profit estimates by 9%–31%.
| Item | Detail |
|---|---|
| Company | Nintendo Co., Ltd. |
| Listing | Tokyo Stock Exchange 7974; U.S. ADR/OTC NTDOY |
| Headquarters | Kyoto, Japan |
| Core business | Dedicated video game hardware, first-party and third-party software, digital sales, subscriptions, mobile/smart-device content, merchandise, film/video, theme-park and licensing ecosystem |
| FY2026 net sales | ¥2.313T, +98.6% year over year |
| FY2026 operating profit | ¥360.1B, +27.5% |
| FY2026 parent profit | ¥424.1B, +52.1% |
| Balance sheet | FY2026 total assets ¥3.805T, net assets ¥2.955T, capital adequacy 77.6% |
| Investment terms | Public-market purchase only; no private allocation terms reviewed |
| Recommendation | Invest with Conditions / Watchlist Buy on Weakness |
Section 2: Market Opportunity Analysis
The relevant market is not just “consoles.” Nintendo competes in interactive entertainment, family media, digital content, and time-spent leisure. Circana estimates U.S. video-game consumer spending reached $60.7B in 2025 and projects $62.8B in 2026, with Switch 2, subscriptions, and major software releases as drivers according to Circana. BCG’s 2026 gaming report describes the industry emerging from its post-pandemic slump, with renewed growth driven by platform convergence, generative AI, UGC/creator ecosystems, cloud gaming, and app-store shifts according to BCG.
| Market layer | Evidence | Cipher view |
|---|---|---|
| Console hardware | Switch lifetime hardware reached 155.92M units and Switch 2 reached 19.86M by March 31, 2026 per Nintendo sales data. | Large installed base; Switch 2 has credible early scale. |
| Software | Switch lifetime software reached 1.528B units; Switch 2 software reached 48.71M by March 31, 2026. | Software attach is the key margin engine. |
| Digital/services | FY2026 digital sales were ¥407.6B, +25.0% year over year. | Strong mix shift, but not pure SaaS. |
| IP extension | Annual report strategy covers visual content, mobile apps, theme parks and merchandise. | Valuable optionality, but still smaller than core platform economics. |
| U.S. market trend | Circana forecasts U.S. video-game spending up 3% to $62.8B in 2026. | Moderate macro tailwind; not explosive enough to ignore cycle risk. |
TAM/SAM/SOM discipline: A fake global TAM number would add false precision. Nintendo’s serviceable market is the global installed base of family/console/mobile-adjacent players willing to pay for hardware, software, subscriptions, and IP merchandise. Its obtainable market is constrained by console pricing, first-party release cadence, manufacturing capacity, third-party support, and regional consumer spend.
Section 3: SWOT Analysis
| Strengths | Weaknesses |
|---|---|
| Switch 2 launch scale is validated: 19.86M hardware units and 48.71M software units in FY2026 per Nintendo results. | Hardware cycles remain visible: FY2025 sales fell 30.3% and operating profit fell 46.6% before the Switch 2 reset. |
| First-party IP moat is exceptional; the annual report explicitly links characters, visual content, mobile apps, theme parks and merchandise back to game-platform demand. | Digital/services are growing but do not yet make Nintendo a recurring-revenue compounder in the same way as subscription-first platforms. |
| Fortress balance sheet: FY2026 net assets ¥2.955T and capital adequacy 77.6%. | FY2027 guidance calls for net sales to decline 11.4% despite a modest operating-profit increase. |
| Nintendo Account spans platform generations, supporting backward compatibility, upgrades, digital sales and long-term engagement. | Hardware economics are exposed to FX, memory/component costs and tariff measures. |
| Opportunities | Threats |
|---|---|
| Switch 2 installed base can drive multi-year software attach, digital upgrades, Nintendo Switch Online, and third-party support. | PlayStation, Xbox, Steam/PC, mobile games, Roblox, Minecraft and Fortnite compete for both wallet and attention. |
| Film/video, theme parks and merchandise can expand IP touchpoints beyond gaming; Nintendo cites this strategy in its annual report. | Component cost inflation and AI-driven demand for memory/compute can pressure margins and retail pricing. |
| Industry convergence may help Nintendo extend franchises across devices while preserving differentiated hardware. | IP enforcement controversies, including high-profile patent/lawsuit narratives around genre-adjacent games, can create reputational risk. |
| Share-price de-rating creates a better entry point than prior highs. | A weak post-launch software slate would quickly compress sentiment and attach-rate expectations. |
Section 4: Competitive Landscape
| Competitor / ecosystem | Where it competes | Nintendo positioning |
|---|---|---|
| Sony PlayStation | Premium console hardware, third-party AAA, subscriptions, exclusives | Sony leads on performance/AAA breadth; Nintendo wins on first-party family IP and portable/console hybrid design. |
| Microsoft Xbox / Game Pass | Console, PC, cloud, subscription library | Microsoft pushes platform-agnostic distribution; Nintendo prioritizes controlled hardware/software/IP integration. |
| PC / Steam | Open platform, indie/AAA breadth, hardware flexibility | PC dominates breadth and modding; Nintendo controls curated experiences and family-safe IP. |
| Mobile gaming | Free-to-play scale, low-friction distribution | Mobile wins reach; Nintendo protects premium IP economics and selectively uses smart-device content. |
| Roblox / Minecraft / Fortnite | UGC, social play, creator economies | Nintendo has less UGC exposure; BCG notes UGC/creator economy as a key growth trend, making this both threat and adjacency. |
| Tencent / NetEase / global publishers | Live services, mobile/PC, global publishing | Larger online/live-service exposure; Nintendo has stronger proprietary family IP. |
Competitive intensity: Orange-to-red ocean. Nintendo has a differentiated island inside a brutally competitive attention market. Its moat is IP plus integrated hardware/software design, not raw compute power or open distribution.
Section 5: Risk Analysis
| Risk | Description | Likelihood | Impact | Mitigation / watch item |
|---|---|---|---|---|
| Console-cycle normalization / outlook miss | Switch 2 launch was strong, but FY2027 sales guidance declines from FY2026 and CNBC reported guidance missed LSEG expectations. | High | High | Track sell-through, software attach, holiday demand, and whether Nintendo revises guidance. |
| Price-hike elasticity and component/tariff cost pressure | Nintendo raised Switch 2 prices in major markets while citing market conditions, component costs and tariff measures. | High | High | Monitor demand after U.S./Europe price changes, Japan sell-through after May 25, gross margin, and inventory. |
| Hit-cadence / games-shortfall concern | Reuters framed the selloff partly around a games shortfall; first-party release quality drives hardware pull and software margins. | Medium | High | Watch release calendar, attach rate excluding bundles, and third-party support. |
| FX exposure | 76.9% of FY2026 sales were outside Japan; forecasts assume 150 JPY/USD and 175 JPY/EUR. | High | Medium | Sensitize earnings to yen moves. |
| Attention competition | Mobile/PC/UGC ecosystems compete for younger players. | High | Medium | Monitor active users, Nintendo Account engagement, Nintendo Switch Online. |
| IP/legal reputation | Aggressive IP enforcement can protect assets but risks backlash. | Medium | Medium | Watch litigation outcomes and fan/developer sentiment. |
| Valuation trap | Stock has fallen sharply, but lower price alone does not eliminate cycle risk. | Medium | Medium | Accumulate only against evidence of durable software/digital attach. |
| Governance/ownership opacity | Japanese share registry and nominee/depositary accounts limit look-through visibility. | Medium | Low | Use annual securities reports and large-holder disclosures. |
Section 6: Team Evaluation
Nintendo is not a founder-led venture, but management and creative continuity are unusually important. President Shuntaro Furukawa has overseen the Switch-to-Switch 2 transition. Representative Director / Fellow Shigeru Miyamoto remains a unique creative asset associated with Mario, Zelda, Donkey Kong and broader Nintendo design culture. The board includes outside expertise relevant to IP expansion; the FY2025 annual report lists Illumination founder Chris Meledandri as an outside director, which is strategically relevant given Nintendo’s film ambitions.
| Dimension | Assessment |
|---|---|
| Operating credibility | High: FY2026 launch execution produced large hardware/software unit volume. |
| Creative credibility | Very high: Nintendo’s historical IP engine remains unmatched. |
| Capital allocation | Strong: dividends, treasury-share repurchase/cancellation, high liquidity. |
| Disclosure quality | Good for financials; less granular than U.S. issuers for engagement/cohort economics. |
| Team score | 4.5 / 5 |
Key gap: More granular Nintendo Account, Nintendo Switch Online, regional digital cohort and subscription disclosure would improve investor underwriting.
Section 7: Financial and Valuation Assessment
FY2026 was a launch-cycle recovery year. Net sales rose 98.6% to ¥2.313T, operating profit rose 27.5% to ¥360.1B, ordinary profit rose 45.6% to ¥542.2B, and parent profit rose 52.1% to ¥424.1B per Nintendo FY2026 results. The lower operating-profit growth versus sales growth is the important nuance: hardware launch years carry marketing, mix, production and cost pressures.
| Metric | FY2025 | FY2026 | Change |
|---|---|---|---|
| Net sales | ¥1.165T | ¥2.313T | +98.6% |
| Operating profit | ¥282.6B | ¥360.1B | +27.5% |
| Parent profit | ¥278.8B | ¥424.1B | +52.1% |
| Digital sales | Not central in this table | ¥407.6B | +25.0% |
| IP-related sales | ~¥81.4B implied prior-year base | ¥73.5B | -9.7% |
| Cash and deposits | ¥1.586T | ¥1.792T | +¥205.5B |
| Net assets | ¥2.725T | ¥2.955T | +¥229.7B |
Public-market stock snapshot
| Item | Cipher Research calculation / source |
|---|---|
| Last close | ¥7,179, 7974.T, May 11, 2026 Yahoo chart API snapshot |
| Day context | -6.1% versus May 8 close in the captured Yahoo chart series; Reuters described the Tokyo move as roughly an 8% slump intraday/market reaction |
| Non-treasury shares | ~1.153B, from FY2026 shares less treasury shares |
| Approx. equity value | ~¥8.28T |
| Cash/deposits | ¥1.792T |
| Approx. enterprise value | ~¥6.48T before other investment/security adjustments |
| FY2026 P/E | ~19.5x |
| FY2027 guided P/E | ~26.7x on ¥310B parent-profit guidance |
| EV/FY2026 sales | ~2.8x |
| EV/FY2026 operating profit | ~18x |
| FY2027 sales guidance vs FY2026 | ¥2.05T, down 11.4% per Nintendo results |
| CNBC-reported LSEG expectation gap | ¥2.05T guidance vs ¥2.46T expected sales; ¥310B guided profit vs ¥418.5B expected profit |
| 1Y stock return | -36.6% based on captured adjusted-close series |
Sell-side triangulation: Goldman Sachs
| Goldman Sachs item | Commentary provided to Cipher Research | Cipher interpretation |
|---|---|---|
| Rating | Buy | External validation that the long-term IP/platform thesis remains investable despite the estimate reset. |
| 12-month target price | ¥10,500, reduced from ¥12,300 | Still implies material upside from the ¥7,179 captured close, but the target cut is a real de-risking signal. |
| FY3/27–FY3/30 operating-profit estimates | Cut by 9%–31% | The market is not overreacting to nothing; sell-side numbers are being reset lower across the forecast horizon. |
| FY3/27 operating-profit guide | ¥370B, below expectations | Confirms the operating-profit softness is central, not merely a revenue-timing issue. |
| Cost headwind | Roughly ¥100B from component prices and tariffs | Matches the main Cipher concern: hardware economics can dilute the IP/software moat in launch-cycle years. |
| Switch 2 hardware shipment assumption | 16.5M units | Lower hardware assumption makes software attach and exclusive release cadence more important to the upside case. |
| Long-term positive | Active console units could reach record highs as exclusive software expands | Supports maintaining Invest with Conditions rather than downgrading to Pass after the stock slump. |
Valuation view: Nintendo is not obviously cheap on earnings if FY2027 profit declines to ¥310B, and the May 2026 price-hike/outlook-miss news reduces the margin for error. The balance sheet and IP durability still justify a premium to ordinary hardware cyclicals, but the stock now belongs in a disciplined watchlist/accumulation framework: buy weakness only when evidence improves on software attach, price elasticity, digital mix and cost pass-through.
Section 8: Go-to-Market Strategy and Traction
Nintendo’s GTM model is unusually integrated: hardware launch, first-party software, third-party support, Nintendo Direct/owned media, retail/digital distribution, Nintendo Account, backward compatibility, upgrade packs, official stores, film/video and character merchandise all reinforce one another.
| Traction metric | Evidence quality | Evidence |
|---|---|---|
| Switch 2 hardware | Strong | 19.86M units in FY2026 per Nintendo results. |
| Switch 2 software | Strong | 48.71M units in FY2026. |
| Mario Kart World | Strong | 14.70M units including bundle sales. |
| Donkey Kong Bananza | Strong | 4.52M units. |
| Legacy Switch installed base | Strong | 155.92M lifetime hardware units per Nintendo sales data. |
| Digital adoption | Strong | FY2026 digital sales ¥407.6B, +25.0%. |
| IP expansion | Moderate | Strategy verified; IP-related business ¥73.5B but down 9.7%. |
| Subscription depth | Moderate/limited | Nintendo Switch Online exists, but detailed NDR/cohort economics not disclosed. |
| Price-hike response | Weak/in progress | Recent price increases create a fresh elasticity test; no post-hike sell-through evidence yet. |
Section 9: Additional Considerations
IP and patents: Nintendo’s IP is the moat. The same aggressiveness that protects it can create litigation and reputational friction. Investors should distinguish between protecting core franchises and overreaching into mechanics that may be perceived as genre conventions.
Regulatory / platform: App-store changes and cloud gaming could alter distribution economics, but Nintendo’s hardware-first approach limits immediate dependence on third-party mobile stores.
Ethical / brand: Nintendo’s family-safe brand is an asset; any supply-chain, labor, privacy, or child-safety issue would carry outsized reputational impact.
AI / cloud / emerging tech: Annual-report R&D language includes cloud computing, VR/AR/MR, deep learning and big data analysis. This is legitimate optionality but not enough to pitch Nintendo as an AI stock.
Exit potential: Not relevant in a normal M&A sense; Nintendo is a strategic public company with national/cultural significance and substantial internal liquidity. The realistic exit is public-market capital appreciation plus dividends.
Section 10: Research and External Validation
Claims supported externally
- Switch 2 launched in 2025 and supports Switch 2 exclusive games plus many physical/digital Switch games according to Nintendo’s announcement.
- Switch 2 reached 19.86M hardware units and 48.71M software units by March 31, 2026 per Nintendo sales data.
- FY2026 net sales were ¥2.313T and operating profit was ¥360.1B per Nintendo FY2026 results.
- Recent price hikes across Japan, U.S., Canada and Europe are externally supported by GamesIndustry.biz and CNBC.
- The May 2026 stock slump and market concern over price hikes/games cadence are externally supported by Reuters.
- Goldman Sachs commentary provided to Cipher Research supports the balanced thesis: Buy maintained, but target price and FY3/27–FY3/30 operating-profit estimates cut after the 4Q miss and soft guidance.
- Industry recovery/convergence themes are externally supported by BCG and Circana.
Claims contradicted or requiring caution
- “Nintendo is now mostly recurring revenue” is not supported; digital sales are meaningful, but hardware/software cycles remain core.
- “Switch 2 eliminates cycle risk” is contradicted by FY2027 sales guidance declining from launch-year FY2026 and by the post-results stock selloff.
- “Price increases are harmless because demand is strong” is not yet proven; the U.S./Europe increases take effect later and Japan’s local increase needs post-May-25 sell-through evidence.
- “Sell-side Buy rating means no estimate risk” is false; Goldman’s maintained Buy came alongside a lower target price and 9%–31% operating-profit estimate cuts.
- “Nintendo has no competitors” is false; it competes broadly for attention, devices, content spend and family entertainment.
Information gaps
- Nintendo Account active-user economics and cohort retention.
- Nintendo Switch Online subscriber count, ARPU, churn and contribution margin.
- Gross margin by hardware vs software vs digital content.
- Regional Switch 2 sell-through vs sell-in.
- Detailed contribution from films, theme parks, official stores and merchandise.
Section 11: Investment Recommendation
Verdict: Invest with Conditions / Watchlist Buy on Weakness ⚠️ Confidence: Medium
Top 3 reasons to own
- Moat quality: Nintendo’s first-party IP portfolio is one of the strongest in global entertainment.
- Switch 2 validation: FY2026 unit sales prove that the next-generation platform has demand.
- Balance-sheet protection: High liquidity, net assets and capital adequacy reduce downside insolvency risk.
- Sell-side support despite cuts: Goldman Sachs maintained Buy and a ¥10,500 12-month target, even after lowering estimates.
Why this is not a clean buy today
- Guidance miss: CNBC reported FY2027 sales and profit guidance materially below LSEG expectations.
- Price hikes: Switch 2 price increases are a fresh elasticity test in Japan, the U.S., Canada and Europe.
- Stock signal: The selloff is not random volatility; Reuters tied it to price hikes and games/software-cadence concerns.
- Estimate reset: Goldman’s 9%–31% FY3/27–FY3/30 operating-profit estimate cuts validate the concern that cost pressure affects more than one quarter.
Top 3 risks
- Cycle risk / guidance miss: FY2027 sales guidance is lower after the launch-year spike and below reported consensus expectations.
- Margin risk: Components, tariffs, advertising, hardware mix and FX can compress profitability.
- Attention risk: Younger players increasingly split time across PC, mobile, UGC and social gaming ecosystems.
Diligence questions
- What is Switch 2 sell-through by region vs channel inventory?
- How many Nintendo Account users are active monthly and annually?
- What is Nintendo Switch Online subscriber count and churn?
- What is the software attach rate for Switch 2 excluding bundled Mario Kart World units?
- How much of digital sales is full-game download vs add-on content vs subscription?
- What is the gross margin differential between Switch 2 hardware and software?
- How much FY2027 cost pressure is tariff-driven versus memory/component-driven?
- What is the long-term target contribution from film, theme parks and merchandise?
Next steps
- Build a quarterly tracker around Switch 2 hardware units, software attach, digital mix, operating margin and inventory.
- Accumulate only when valuation reflects cycle fear, not during uncritical launch enthusiasm.
Section 12: Cap Table Analysis & Dilution Modeling
Nintendo has one common-share class for ordinary public-equity purposes in the reviewed filings. The FY2026 results disclose 1,287,260,000 shares outstanding including treasury shares and 134,431,295 treasury shares as of March 31, 2026, implying roughly 1,152,828,705 non-treasury shares.
| Share / ownership item | Detail |
|---|---|
| Shares outstanding incl. treasury, Mar. 31 2026 | 1,287,260,000 |
| Treasury shares, Mar. 31 2026 | 134,431,295 |
| Approx. non-treasury shares | 1,152,828,705 |
| Voting structure | One common-share structure identified in reviewed English filings |
| Recent capital action | FY2026 treasury-share purchases and cancellation noted in company materials |
| Warrants/convertibles | No material public-company venture-style dilution overhang identified in reviewed materials |
Major holders from FY2025 annual report
| Shareholder | Shares held | % excl. treasury |
|---|---|---|
| The Master Trust Bank of Japan, Ltd. Trust Account | 194.1M | 16.67% |
| Custody Bank of Japan, Ltd. Trust Account | 65.0M | 5.58% |
| The Bank of Kyoto, Ltd. | 48.8M | 4.19% |
| JP Morgan Chase Bank 380815 | 43.2M | 3.71% |
| The Nomura Trust and Banking Co., Ltd. | 42.1M | 3.62% |
| State Street Bank and Trust Company 505001 | 35.3M | 3.03% |
| JP Morgan Chase Bank 385632 | 26.9M | 2.31% |
| State Street Bank West Client Treaty 505234 | 23.8M | 2.05% |
| Citibank depositary bank for depositary share holders | 23.3M | 2.00% |
| State Street Bank and Trust Company 505103 | 18.8M | 1.62% |
Governance interpretation: The shareholder base is heavily institutional/nominee. Public ADR ownership is represented through depositary structures rather than a separate venture-style cap table. Treasury shares are material and shareholder returns are explicit through dividends and buybacks.
Section 13: Founder Deep-Dive
Nintendo was founded in 1889 by Fusajiro Yamauchi as a playing-card company; the modern investment case is not founder-risk in the startup sense. The key “founder-like” asset is creative continuity: Shigeru Miyamoto’s role in Mario, Zelda and Donkey Kong remains culturally and strategically important, while Shuntaro Furukawa’s management tenure covers the late Switch era and Switch 2 transition.
| Topic | Assessment |
|---|---|
| Founder continuity | Not founder-led; institutionalized creative culture matters more than founder control. |
| Key-person risk | Moderate: Miyamoto is iconic, but Nintendo’s creative production is broader than one person. |
| Executive controversy search | No verified executive-firing or personal litigation red flag identified in the reviewed sources. |
| Company controversy | IP litigation and enforcement posture can create public-relations risk. |
| Co-founder instability benchmark | Startup co-founder attrition statistics are not directly applicable to a 135+ year public company. |
Section 14: Quantitative Scoring Model
| Dimension | Weight | Score | Weighted contribution | Rationale |
|---|---|---|---|---|
| Team | 25% | 8 | 20.0 | Proven management/creative culture; not founder-led but highly capable. |
| Market | 20% | 8 | 16.0 | Large global gaming/IP market with renewed growth, but not winner-take-all. |
| Traction | 20% | 8 | 16.0 | Switch 2 launch is strong, but recent market concern around software cadence and price elasticity reduces confidence. |
| Financials | 15% | 7 | 10.5 | Profitable, liquid, cash-rich; FY2027 outlook miss, price hikes, Goldman’s 9%–31% estimate cuts and margin pressure matter. |
| Competitive | 10% | 8 | 8.0 | Exceptional IP moat, intense attention competition. |
| Risk profile | 10% | 6 | 6.0 | Cycle, FX, components, tariffs, estimate resets and hit cadence are meaningful. |
| Total | 100% | 76.5 | Invest-with-conditions threshold, with cycle-aware entry discipline. |
Score: 77/100. Interpretation: Invest with conditions / Watchlist Buy on Weakness, not a momentum chase.
Section 15: Stage-Specific Benchmarking
Nintendo is not a venture-stage SaaS company, so seed/Series A benchmarks are not decision-useful. Public-company benchmarking should focus on scale, margin, liquidity, installed base and repeat monetization.
| Benchmark type | Nintendo result | Assessment |
|---|---|---|
| Revenue scale | FY2026 net sales ¥2.313T | Massive public-company scale. |
| Profitability | FY2026 operating profit ¥360.1B | Strong absolute profit; margin lower than pure software due to hardware mix. |
| Balance sheet | Net assets ¥2.955T; capital adequacy 77.6% | Best-in-class resilience. |
| Installed base | Switch 155.92M lifetime units; Switch 2 19.86M units | Large ecosystem and credible next-cycle base. |
| Digital mix | Digital sales ¥407.6B, +25.0% | Positive but not enough disclosure for SaaS-style NDR. |
| Burn multiple | Not applicable | Nintendo is profitable and cash-generative; venture burn metric not meaningful. |
| NDR / LTV:CAC | Not disclosed | Investor gap; use attach rate and digital mix as substitutes. |
Section 16: Comparable Transactions Analysis
For Nintendo, public-market comparables and strategic gaming transactions are more relevant than venture rounds. Exact revenue multiples vary by date and accounting mix, so this table is directional.
| Company / transaction | Type | Approx. strategic relevance | Revenue multiple | Key investors / acquirer | Date |
|---|---|---|---|---|---|
| Activision Blizzard / Microsoft | Strategic acquisition | AAA IP, publishing, platform content | High single-digit revenue multiple at announcement, depending on period used | Microsoft | 2023 close |
| Electronic Arts public-market / take-private discussions | Public-market strategic comp | Sports/live-service console and PC publishing | Market-dependent | Public holders / strategic-financial buyers | 2025–2026 news context |
| Sony Interactive Entertainment | Public segment competitor | Premium console ecosystem and first-party studios | Segment not separately traded | Sony Group | Ongoing |
| Roblox | Public UGC/social platform | Younger-player engagement and creator economy | High-growth platform multiple | Public shareholders | Ongoing |
| Tencent games ecosystem | Public strategic competitor | Mobile/PC publishing, global gaming investments | Conglomerate multiple not directly comparable | Tencent/public shareholders | Ongoing |
Conclusion: Nintendo deserves a premium to hardware-only cyclicals and a discount to pure high-growth software platforms. Its best comp set is a hybrid of Disney-like IP, Sony-like hardware/platform, and proprietary game publisher economics.
Section 17: Unit Economics Deep-Dive
Nintendo does not disclose SaaS-style CAC, LTV, churn or NDR. The correct diligence substitute is platform economics: hardware installed base, software attach, digital mix, subscription/services contribution, first-party hit rate, and IP monetization.
| Unit-economic metric | Nintendo disclosure / proxy | Assessment |
|---|---|---|
| CAC | Not disclosed; marketing and advertising rose with platform launch. | Cannot compute; watch advertising as % of sales. |
| LTV | Not disclosed; proxy is lifetime hardware/software attach plus digital/subscription/IP spend. | Very high for engaged Nintendo households, but not quantified. |
| LTV/CAC | Not disclosed. | Information gap. |
| Payback period | Not disclosed. | Hardware launch payback depends on software attach and lifetime digital spend. |
| Gross margin | Not fully broken out by platform/content in reviewed materials. | Likely pressured by hardware mix; software/digital margins should be structurally better. |
| Burn multiple | Not applicable. | Nintendo is profitable, not venture-burn funded. |
| Net dollar retention | Not disclosed. | Nintendo Account cohorts would be the right metric. |
| Magic Number | Not applicable. | Use software attach and digital-sales growth instead. |
| Software attach proxy | Switch 2 FY2026 software 48.71M / hardware 19.86M = ~2.45x early attach. | Good early-cycle base; bundled units should be separated in further diligence. |
| Digital monetization | FY2026 digital sales ¥407.6B, +25%. | Positive quality-of-revenue trend. |
Bottom line: Nintendo’s unit economics are attractive because IP-driven software and digital revenue ride on hardware installed base. The underwriting risk is that Nintendo does not disclose enough cohort/subscription detail to prove a smooth recurring-revenue transition.
Final Recommendation
Nintendo is a real moat asset, not a fad console trade. The Switch 2 cycle is validated, the balance sheet is excellent, and the IP engine remains world-class. The right public-equity posture is Invest with Conditions / Watchlist Buy on Weakness: own it only when cycle fear gives entry discipline and when post-hike demand/attach evidence supports the thesis; do not underwrite it like a SaaS compounder or ignore hardware cadence.
Public-Market Stock Analysis Appendix — 7974.T / NTDOY Expanded
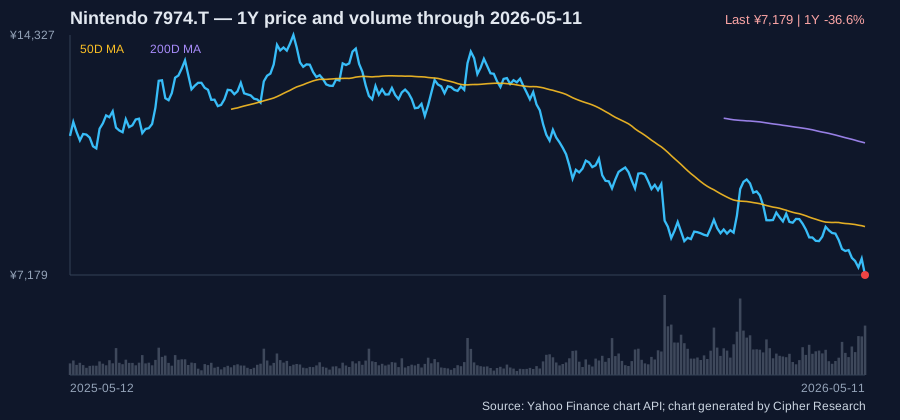
A. Trading snapshot
| Metric | 7974.T primary listing | NTDOY ADR context |
|---|---|---|
| Latest captured close | ¥7,179 on May 11, 2026 | $10.45 on May 8, 2026 |
| 1Y adjusted-close range | ¥7,179–¥14,327 | $10.45–$24.89 |
| Latest captured volume | 21.01M shares | 9.79M ADR shares |
| 1Y average daily volume | ~6.88M shares | ~2.07M ADR shares |
| 1Y average daily traded value | ~¥72.5B | ~$36.3M |
| Liquidity read | Institutional-grade local liquidity | Tradable ADR liquidity but primary price discovery is Tokyo |
B. Return and drawdown profile
| Period | 7974.T return | NTDOY return | Interpretation |
|---|---|---|---|
| 1 month | -18.9% | -21.9% | Recent selloff is material, not normal noise. |
| 3 months | -26.1% | -24.4% | Market is discounting Switch 2 profitability/second-year risk. |
| 6 months | -43.8% | -52.5% | Severe de-rating from launch-cycle optimism. |
| 1 year | -36.6% | Not calculated from full 252-day ADR window in this snapshot | Entry is better than peak, but not automatically cheap. |
| May 11 Tokyo move | -6.1% versus May 8 close in Yahoo captured data; Reuters described shares as down about 8% in Tokyo | ADR last captured May 8, before full Tokyo reaction | Confirms news-driven repricing. |
C. Valuation bridge
| Valuation item | Cipher estimate | Comment |
|---|---|---|
| Non-treasury shares | ~1.153B | FY2026 shares outstanding less treasury shares. |
| Equity value at ¥7,179 | ~¥8.28T | Market value of non-treasury shares. |
| Cash/deposits | ¥1.792T | FY2026 company disclosure. |
| Approx. enterprise value | ~¥6.48T | Before deeper securities/investments/debt adjustments. |
| FY2026 P/E | ~19.5x | Based on ¥424.1B parent profit. |
| FY2027 guided P/E | ~26.7x | Based on ¥310B guided parent profit; this is the valuation pressure point. |
| EV/FY2026 sales | ~2.8x | Reasonable for IP/platform quality, high for hardware cyclicality. |
| EV/FY2026 operating profit | ~18x | Requires confidence that Switch 2 software/digital attach improves. |
D. News-driven catalyst/risk tracker
| Catalyst / risk | Evidence | Investment implication |
|---|---|---|
| Switch 2 price hike | CNBC: U.S. price rises from $449.99 to $499.99; GamesIndustry.biz: Japan-only Switch 2 rises from ¥49,980 to ¥59,980, with Canada/Europe increases also disclosed. | Price elasticity and brand/accessibility risk move up the diligence stack. |
| Component/memory inflation | CNBC: memory-price crunch and roughly ¥100B FY2027 impact from rising components and tariff measures. | Gross margin improvement is less certain despite launch scale. |
| Outlook below expectations | CNBC: FY2027 sales/profit guidance below LSEG expectations; Goldman highlighted FY3/27 operating-profit guidance of ¥370B as well below expectations. | Explains stock reaction; lowers score. |
| Goldman Sachs estimate reset | GS maintained Buy but lowered 12-month target price to ¥10,500 from ¥12,300 and cut FY3/27–FY3/30 operating-profit estimates by 9%–31%. | Keeps upside case alive, but confirms the next 12 months need proof, not narrative. |
| Games/software-cadence concern | Reuters: shares slumped as price hikes and games shortfall spooked market. | Attach-rate evidence must be watched separately from hardware unit headlines. |
| High trading volume on selloff | Yahoo chart snapshot: 21.01M shares traded on May 11 vs ~6.88M 1Y average. | Institutional repricing rather than thin-market anomaly. |
E. Technical / entry discipline conclusion
Nintendo’s chart now says the market is forcing discipline. The selloff creates a better entry than the prior peak, but price alone is not a thesis. The investable setup requires evidence that (1) Japan demand holds after May 25 price changes, (2) U.S./Canada/Europe demand holds after Sept. 1 price changes, (3) software attach expands beyond bundled Mario Kart World, (4) component/tariff pressure does not overwhelm digital/software margin mix, and (5) management either beats or raises the conservative FY2027 guide, and (6) sell-side estimate cuts stop widening. Goldman’s Buy/¥10,500 view provides upside triangulation, but the reduced target and forecast cuts reinforce that entry discipline is mandatory. Until then, the right stance is Invest with Conditions / Watchlist Buy on Weakness.