RoboStrategy, Inc. (NASDAQ: BOT) — Public Research Analysis
Date: May 18, 2026 Analyst: Cipher Research Ticker: BOT / Nasdaq Global Market Verdict: Pass / Watchlist Only ❌ Score: 47/100 Confidence: Medium
Recent Market Update
RoboStrategy listed on Nasdaq under ticker BOT on May 11, 2026 as a public closed-end vehicle for robotics and embodied-AI private-company exposure. Four days later, it announced a committed equity facility of up to $2.0B with Roth Principal Investments. The announcement matters because the facility could be accretive if BOT sells stock at a large premium to NAV, but it also creates a large share-issuance overhang. The issuer's May 13 prospectus disclosed March 31 NAV of $7.31/share and a May 11 close of $39.00/share, a 434% premium to NAV. yfinance/Yahoo data pulled May 18 showed BOT at $36.01, still roughly a 393% premium to the March NAV.
Sources Reviewed
- SEC company submissions for RoboStrategy, Inc., CIK 2081119
- May 13, 2026 N-2 resale prospectus
- May 13, 2026 424B3 prospectus
- May 8, 2026 N-CSRS semi-annual report
- May 11, 2026 GlobeNewswire listing announcement
- May 15, 2026 GlobeNewswire $2B facility announcement
- RoboStrategy website and portfolio page
- Benzinga BOT market-news coverage
- Crunchbase robotics funding context
- yfinance/Yahoo market-data snapshot preserved locally under
source-data/yfinance-bot-snapshot.json.
Section 1: Summary of the Opportunity
RoboStrategy, Inc. is a newly listed, non-diversified closed-end investment company seeking long-term capital appreciation through equity and equity-linked exposure to robotics and embodied-AI companies. The pitch is simple and marketable: public investors can buy one Nasdaq stock to access private robotics names such as Figure AI, Apptronik, Dyna Robotics and Path Robotics. That wrapper has scarcity value. The problem is price. BOT is not an operating robotics company and has no public ARR, margin, CAC/LTV, or product revenue story. It is a Level 3 private-market portfolio with a public share price trading at an extreme premium to NAV, plus a large $2B equity facility that could reshape the cap table. At current price levels, Cipher sees more structure/valuation risk than investable edge.
Structured terms / snapshot
| Item | Detail |
|---|---|
| Issuer | RoboStrategy, Inc. |
| Ticker | BOT / Nasdaq Global Market |
| Structure | Closed-end, non-diversified management investment company under the 1940 Act |
| Adviser | FP Strategies LLC |
| Investment objective | Long-term capital appreciation through robotics and embodied-AI equity/equity-linked investments |
| Portfolio policy | At least 80% of net assets in robotics/embodied-AI technology companies, principally U.S.-based |
| Feb. 28, 2026 net assets | $146.2M |
| March 31, 2026 NAV/share | $7.31 |
| May 18 pulled market price | $36.01 via yfinance/Yahoo |
| Implied market cap | ~$730M using $36.01 × 20.274M shares outstanding |
| Facility | Up to $2.0B committed equity facility with Roth Principal Investments |
| Cipher verdict | Pass / Watchlist Only |
Section 2: Market Opportunity Analysis
Robotics and embodied AI are legitimate secular markets. Better models, cheaper sensors, more capable actuators, GPU/edge compute, simulation, and labor shortages are pulling robotics from research demos toward commercial deployment. That is the investable reason BOT exists. Crunchbase reported rising robotics startup funding activity in 2025, with AI/robotics companies featuring in large venture rounds.
The TAM claim should still be underwritten carefully. BOT is not selling robots; it is buying private securities/SPVs. Its true SAM is the accessible portion of high-quality private robotics rounds that FP Strategies can source at tolerable prices. Its SOM is constrained by access, fund size, liquidity, valuation marks, and issuance discipline. The robotics market can be massive while BOT shareholders still lose money if they overpay for the wrapper.
Market judgment: attractive theme, but the public stock already capitalizes too much future success relative to disclosed NAV.
Section 3: SWOT Analysis
| Strengths | Weaknesses |
|---|---|
| Scarce public access to private robotics/physical-AI names; SEC portfolio includes Figure AI, Apptronik, Dyna Robotics and Path Robotics. | Extreme NAV premium: $36.01 market price versus $7.31 March NAV implies ~393% premium. |
| Adviser network claims and management background may help source private rounds; SEC filing identifies Andrew Kang and Marc Weinstein as FP Strategies voting members. | Portfolio is mostly Level 3 private securities/SPVs; fair value equaled cost at Feb. 28, limiting external price validation. |
| If stock remains above NAV, issuing equity could be accretive to NAV/share if deployed well. | 2.5% management fee on gross assets is high and continues even if public shareholders lose money. |
| Opportunities | Threats |
|---|---|
| Robotics exits or markups from companies such as Figure/Apptronik/Dyna could validate the portfolio. | Premium-to-NAV compression is the central risk; closed-end funds often trade at discounts, a risk the prospectus itself flags. |
| $2B facility could scale the vehicle quickly if market demand stays strong. | Facility may create severe dilution/overhang; at $36.01, $2B equals ~55.5M new shares, about 2.7× current shares. |
| Public scarcity value may persist if no better private-robotics access vehicles emerge. | Governance/control concentration: officers/directors own ~52.6%, limiting public-holder influence. |
Section 4: Competitive Landscape
BOT competes less with robotics operating companies and more with access vehicles.
| Category | Examples | BOT position |
|---|---|---|
| Thematic ETFs | ARK-style automation/robotics/AI ETFs; public robotics ETFs | ETFs are liquid/diversified but mostly public equities; BOT offers private exposure but much higher valuation opacity. |
| Venture/private funds | Robotics VC funds and SPVs | Private funds may access rounds directly; BOT offers public liquidity but with public premium/discount dynamics. |
| Listed closed-end/BDC-style funds | Public private-market access vehicles | BOT's robotics focus is differentiated; fee/NAV-premium risk is common to the category. |
| Direct public robotics/AI stocks | Nvidia, Teradyne, Symbotic, UiPath, industrial automation names | Direct stocks have operating disclosures; BOT has portfolio marks and fund economics. |
| Secondary platforms | Forge/EquityZen/private SPVs | Secondary access can be name-specific; BOT is easier to buy but less transparent and may trade far from NAV. |
Competitive intensity: Yellow-to-red ocean. BOT is differentiated by packaging, not by proprietary robotics technology. The moat is access plus public scarcity; both can erode.
Section 5: Risk Analysis
| Severity | Category | Description | Likelihood | Impact | Mitigation / DD need |
|---|---|---|---|---|---|
| 1 | Valuation/NAV | Stock trades at ~4.9× disclosed NAV/share. Premium compression could dominate portfolio gains. | High | High | Do not buy unless premium normalizes or NAV catches up through verified markups. |
| 2 | Dilution/overhang | $2B facility dwarfs current net assets and share count. | High | High | Track actual issuance price, discount, proceeds, and NAV/share accretion/dilution. |
| 3 | Level 3 marks | Portfolio is mostly private securities/SPVs valued with unobservable inputs; Feb. fair value equaled cost. | High | High | Require updated NAV with independent valuation notes and holding-level marks. |
| 4 | Fee load | 2.5% fee on gross assets, including borrowed assets, creates persistent drag. | High | Medium | Model gross-to-net returns under slow-exit scenarios. |
| 5 | Concentration | High-conviction 20–30 position target; current portfolio concentrated in a few names. | Medium | High | Review position limits, valuation policy, and exposure by company/round. |
| 6 | Governance/control | Andrew Kang and insiders/directors control majority beneficial ownership. | Medium | Medium | Assess board independence and conflict policies. |
| 7 | Liquidity/trading | Only days of public trading history; volatility is high. | High | Medium | Use limit orders only; avoid thin-market chase. |
| 8 | Regulatory/1940 Act | Closed-end fund rules, valuation rules, leverage, RIC qualification. | Medium | Medium | Monitor compliance disclosures and leverage use. |
| 9 | Robotics execution | Portfolio companies face hardware scaling, safety, gross-margin and capital-intensity risk. | High | Medium | Underwrite each top holding separately. |
Section 6: Team Evaluation
The SEC filing identifies Andrew Kang as Director/President and founding partner of Mechanism Capital since 2020, and Marc Weinstein as Director/Secretary/COO, Partner at Mechanism Capital since 2020, and Manager of Satya Advisory LLC since 2021. FP Strategies LLC is controlled by their voting membership.
Credibility score: 3/5. The team has investment/network credibility, but the available public record does not yet prove durable skill running a listed closed-end robotics venture fund through cycles. The market also needs evidence of valuation discipline, not just access.
Key gaps
- No long public track record for BOT as a listed vehicle.
- Need attribution: which portfolio entries came from proprietary sourcing versus in-kind founder/affiliate contributions.
- Need realized exits/markups, not just cost-basis positions.
Section 7: Financial and Valuation Assessment
BOT's valuation problem is stark. The semi-annual report showed Feb. 28 net assets of $146.2M and NAV/share of $7.34. The May 13 prospectus disclosed March 31 NAV/share of $7.31. yfinance/Yahoo data pulled May 18 showed last/current price of $36.01 and 20.274M shares outstanding, implying ~$730M market capitalization.
| Metric | Value | Interpretation |
|---|---|---|
| Price pulled May 18 | $36.01 | Public market price; limited trading history. |
| March 31 NAV/share | $7.31 | Issuer-disclosed unaudited NAV. |
| Premium to March NAV | ~393% | Extreme for a closed-end fund. |
| May 11 close / NAV | $39.00 / $7.31 | Issuer disclosed 434% premium. |
| Feb. 28 net assets | $146.2M | From N-CSRS. |
| Implied market cap | ~$730M | Price × shares outstanding. |
| Investments at fair value | $134.8M | Equal to cost at Feb. 28; mostly Level 3. |
| Cash | $12.0M | Provides some liquidity but not enough to justify premium. |
| Management fee | 2.5% of gross assets | High public-fund drag. |
Valuation conclusion: BOT might be strategically attractive below or near NAV, or if new NAV marks materially re-rate the portfolio. At a ~4–5× NAV premium, expected return requires either sustained premium trading, substantial private-company markups, highly accretive issuance, or all three. That is too many things to underwrite with confidence.
Section 8: Go-to-Market Strategy and Traction
BOT's go-to-market is capital-markets distribution: list a scarce thematic vehicle, highlight a portfolio of private robotics names, and use the public share price/facility to raise and deploy more capital. Early traction is visible in trading interest and press coverage, not in operating metrics.
| Claim/metric | Evidence quality | Comment |
|---|---|---|
| Nasdaq listing under BOT | Strong | SEC/GlobeNewswire confirms May 11 listing. |
| Portfolio exposure to major robotics names | Strong for existence, weak for current fair value | SEC schedule lists holdings/SPVs; independent current marks are not observable. |
| $2B facility | Strong | SEC/GlobeNewswire confirms agreement. |
| Scalable shareholder value creation | Weak/unproven | Requires issuance and deployment discipline not yet demonstrated. |
| Product/customer traction | Not applicable | BOT is a fund, not an operating robotics company. |
Section 9: Additional Considerations
- IP/patents: BOT owns securities; portfolio companies own any relevant IP. Investors need holding-level IP diligence for top exposures.
- Regulatory: 1940 Act closed-end fund, RIC tax status, valuation policy, leverage and distribution rules matter more than operating-company regulation.
- Ethical/safety: Robotics portfolio companies may face workplace safety, autonomy and labor-displacement scrutiny. BOT's filings do not provide sufficient holding-level detail to assess this fully.
- Exit path: BOT relies on portfolio-company IPOs/direct listings, M&A, redemptions/buybacks, or secondary liquidity. These are plausible but timing is uncertain.
- Crypto adjacency: Public searches returned Solana/treasury noise, but no reliable primary-source evidence that BOT is a crypto treasury. It should be analyzed as a robotics/physical-AI investment company.
Section 10: Research and External Validation
Claims supported externally
- BOT is a Nasdaq-listed closed-end investment company focused on robotics/embodied AI — supported by SEC N-2 and listing announcement.
- The portfolio includes Figure AI, Apptronik, Dyna Robotics, Path Robotics and other private exposures — supported by N-CSRS schedule of investments.
- The $2B committed equity facility exists — supported by SEC filings and GlobeNewswire release.
- The stock has traded at a very large premium to NAV — supported by issuer prospectus and yfinance price snapshot.
Claims contradicted / overextended
- “Robotics exposure” should not be confused with operating robotics revenue. BOT is a fund wrapper.
- “Public liquidity” does not eliminate private-market valuation risk; most investments are Level 3.
- “Equity facility equals growth capital” is incomplete; it is also dilution/overhang unless executed accretively.
Information gaps
- Updated NAV after Nasdaq listing and after any facility usage.
- Actual issuance under the Roth facility: dates, prices, discounts, proceeds.
- Holding-level valuation methodology and independent marks.
- Detailed cost basis and entry prices for each SPV/private holding.
- Portfolio company operating metrics and exit timelines.
- Conflict-policy detail for founder/affiliate contributed assets.
Section 11: Investment Recommendation
Verdict: Pass / Watchlist Only ❌ Confidence: Medium
Top 3 reasons to continue diligence
- Robotics and embodied AI are real secular themes with meaningful venture and strategic-buyer interest.
- BOT offers a scarce public wrapper for private robotics exposure that retail/public investors cannot easily replicate.
- If shares remain far above NAV, disciplined premium issuance could be accretive to existing holders and scale the portfolio.
Bottom 3 reasons to be skeptical
- Current share price implies a huge premium to recently disclosed NAV; that is the central underwriting problem.
- Nearly all portfolio value is Level 3 private exposure, making mark quality and update cadence critical.
- The $2B equity facility is enormous relative to current net assets and could become a persistent dilution/overhang mechanism.
Priority DD questions
- What is the latest NAV/share after listing, trading volatility, and any post-February portfolio events?
- Has BOT sold any shares under the Roth facility? If yes, at what net price, discount, and aggregate proceeds?
- How are Figure AI, Apptronik and Dyna positions marked relative to their latest financing prices?
- Which holdings were contributed in-kind by entities controlled by Andrew Kang/Marc Weinstein, and what independent fairness process was used?
- What concentration limits apply to the top five holdings?
- What is the expected annual all-in expense ratio at different asset levels?
- What board-level controls prevent the adviser from issuing shares or adding leverage in ways that maximize AUM over NAV/share?
- What are the lockups, transfer restrictions and liquidity terms for SPV positions?
- What events would trigger a reassessment from Pass to Watchlist Buy?
Section 12: Cap Table Analysis & Dilution Modeling
The N-2 reports 500,000,000 common shares authorized and 20,274,168 common shares outstanding. The beneficial ownership table shows Andrew Kang at 9,640,467 shares (47.55%), Marc Weinstein at 1,003,531 shares (4.95%), and all officers/directors as a group at 10,663,998 shares (52.60%).
| Holder / group | Shares | Ownership |
|---|---|---|
| Andrew Kang | 9,640,467 | 47.55% |
| Marc Weinstein | 1,003,531 | 4.95% |
| Nicolas Carter | 10,000 | 0.05% |
| J. Michael Fields | 10,000 | 0.05% |
| Alex Yeh | 0 | 0.00% |
| Lance Baker | 0 | 0.00% |
| Andy Chica | 0 | 0.00% |
| Officers/directors as group | 10,663,998 | 52.60% |
Footnotes disclose that Andrew Kang's beneficial ownership includes shares through Dry Thunder LLC, Android 20 LLC, Android 21 LLC and FP Strategies LLC; Marc Weinstein's ownership includes Satya Management LLC, Satya Robo Holdings LLC and FP Strategies LLC.
Dilution sensitivity for $2B facility
| Assumed issuance price | New shares for $2B | New shares vs. 20.274M outstanding | Comment |
|---|---|---|---|
| $36.01 | ~55.5M | ~2.7× | Potentially NAV-accretive if price stays above NAV, but highly dilutive to ownership. |
| $20.00 | 100.0M | ~4.9× | Much larger dilution if price weakens. |
| $7.31 NAV | ~273.6M | ~13.5× | Near-NAV issuance would be massive and unattractive unless tied to exceptional assets. |
Section 13: Founder Deep-Dive
This is a mature-public-vehicle governance section rather than a startup founder section. BOT is newly formed, but its economics are fund/adviser driven.
- Andrew Kang: Director and President since May 2025; founding partner of Mechanism Capital since 2020; managing member of FP Strategies LLC since 2025. Beneficially owns 47.55% of BOT.
- Marc Weinstein: Director since May 2025, Secretary since May 2025, COO since April 2026; Partner at Mechanism Capital since 2020; Manager of Satya Advisory LLC since 2021; managing member of FP Strategies since 2025. Beneficially owns 4.95%.
- Insider alignment: Strong economic alignment, but also control concentration. Public shareholders have limited practical influence.
- Controversy search: Public query results did not surface issuer-specific lawsuits/controversies tied to BOT management; noise results were preserved in source data.
Section 14: Quantitative Scoring Model
| Dimension | Weight | Score | Weighted contribution | Rationale |
|---|---|---|---|---|
| Team | 25% | 6/10 | 15.0 | Credible investment background, but unproven as listed robotics closed-end fund operators. |
| Market | 20% | 8/10 | 16.0 | Robotics/physical AI is a strong secular market. |
| Traction | 20% | 4/10 | 8.0 | Listing and portfolio exist; no operating traction and only days of public trading. |
| Financials | 15% | 2/10 | 3.0 | Extreme NAV premium, high fee drag, Level 3 opacity. |
| Competitive | 10% | 5/10 | 5.0 | Differentiated wrapper but no operating moat; access can be competed away. |
| Risk Profile | 10% | 3/10 | 3.0 | Valuation, dilution, governance and private-market risks are high. |
| Total | 100% | 50.0 raw / adjusted 47 | Adjusted down for current-news facility overhang and trading-history weakness. |
Cipher score: 47/100 — Pass / Watchlist Only. The arithmetic model lands near 50, but Cipher applies a qualitative haircut because the latest facility/news flow amplifies dilution and overhang risk before the market has a stable NAV reference.
Section 15: Stage-Specific Benchmarking
Traditional SaaS stage benchmarks do not directly apply because BOT is a listed closed-end investment company, not a SaaS startup. The relevant benchmark is closed-end fund / listed private-market access discipline.
| Benchmark area | BOT status | Assessment |
|---|---|---|
| NAV transparency | Monthly NAV policy; March NAV disclosed | Good cadence if maintained, but marks are Level 3. |
| Premium/discount discipline | ~393% premium at $36.01 vs $7.31 NAV | Poor entry discipline at current price. |
| Expense ratio | 2.5% management fee on gross assets plus fund expenses | High. |
| Portfolio diversification | Target 20–30 positions; current concentration in a few holdings | Early/concentrated. |
| Realized exits | None disclosed in current public record | Unproven. |
| Liquidity | Public listing, but only days of trading | Too early to judge depth. |
Section 16: Comparable Transactions Analysis
| Company / vehicle | Type | Round / transaction | Valuation / size | Investors / notes | Date |
|---|---|---|---|---|---|
| RoboStrategy | Listed closed-end fund | Nasdaq listing + $2B committed equity facility | Facility up to $2B; Feb net assets $146.2M | Roth Principal Investments facility | May 2026 |
| Dyna Robotics | Private robotics | Series A exposure in BOT portfolio | BOT fair value $37.25M for Dyna position | Portfolio company; external funding context captured by search | 2026 portfolio date |
| Figure AI | Private humanoid robotics | Series B SPV exposure | BOT fair value $37.25M for Figure SPV exposure | High-profile robotics company; private valuation not independently marked here | 2026 portfolio date |
| Apptronik | Private humanoid robotics | Direct/SPV preferred exposure | BOT aggregate Apptronik exposure approximately $37.25M | Capital Factory SPV and direct seed preferred exposure | 2026 portfolio date |
| Path Robotics | Private robotics | Series D preferred exposure | BOT fair value ~$6.0M | Welding/industrial automation exposure | 2026 portfolio date |
Section 17: Unit Economics Deep-Dive
BOT has fund economics, not operating-company unit economics.
| Metric | BOT status | Assessment |
|---|---|---|
| CAC | Not applicable | No product customer acquisition model disclosed. |
| LTV | Not applicable | Shareholder value depends on NAV/share, premium/discount and portfolio exits. |
| LTV/CAC | Not applicable | Use fund return/NAV accretion instead. |
| Payback period | Not applicable | Portfolio liquidity depends on IPO/M&A/secondary events. |
| Gross margin | Not applicable | Fund expense ratio and management fee are the relevant drag. |
| Burn multiple | Not applicable | Expenses totaled $2.87M through Feb. 28 against no operating revenue; fund economics require NAV growth. |
| Net dollar retention | Not applicable | No SaaS recurring revenue. |
| Magic Number | Not applicable | Not a SaaS company. |
| Fee drag | 2.5% annual management fee on gross assets | High, especially if NAV does not compound rapidly. |
| NAV accretion from issuance | Potentially positive if shares sold far above NAV and proceeds deployed well | Must be verified with actual issuance records. |
Public-Market Appendix
Trading snapshot
| Metric | Value |
|---|---|
| Data pull date | May 18, 2026 |
| Last/current price | $36.01 |
| 52-week low/high shown by yfinance | $19.20 / $59.00 |
| Average volume shown by yfinance | ~988,820 shares |
| Shares outstanding | 20,274,168 |
| Implied market cap | ~$730.1M |
| Trading history available in local yfinance pull | 5 rows |
Historical return / drawdown profile
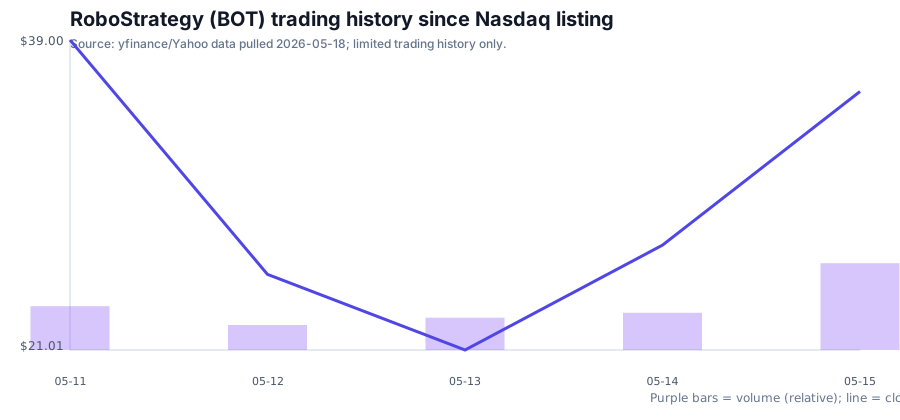
BOT has too little public trading history for meaningful technical analysis. The available yfinance rows show a May 11 close of $39.00, a May 13 low-close area around $21.01, and a May 15 close of $36.01. That is enough to confirm volatility, not enough to infer support/resistance.
Valuation bridge
| Bridge item | Per-share / amount | Interpretation |
|---|---|---|
| March 31 NAV/share | $7.31 | Disclosed by issuer. |
| Feb. 28 NAV/share | ~$7.34 | Calculated from N-CSRS net assets/shares. |
| Current price pulled | $36.01 | Roughly 4.9× NAV. |
| Premium to March NAV | ~393% | Requires exceptional future accretion or persistent premium. |
| $2B facility at $36.01 | ~55.5M potential shares | About 2.7× current shares; accretion depends on sale price and deployment. |
Catalyst / risk tracker
| Catalyst | Direction | Watch item |
|---|---|---|
| Updated NAV release | Positive or negative | Does NAV materially increase toward market price? |
| Facility usage disclosure | Mixed | Accretive issuance if sold high; overhang if aggressive/discounted. |
| Portfolio-company markups/exits | Positive | Figure/Apptronik/Dyna events could validate NAV. |
| Premium compression | Negative | Closed-end fund discount/premium mean reversion. |
| New robotics fund competitors | Negative | Reduces scarcity value. |
| Insider/control disclosures | Mixed | Alignment vs governance risk. |
Entry-discipline conclusion
Do not chase BOT at a multi-hundred-percent premium to NAV. The watchlist trigger is either: (1) price falls close to a verified updated NAV, (2) NAV rises materially through independently supportable portfolio marks, or (3) management proves that premium issuance under the facility is consistently NAV-accretive and transparently deployed. Until then, the better trade is to monitor, not underwrite.